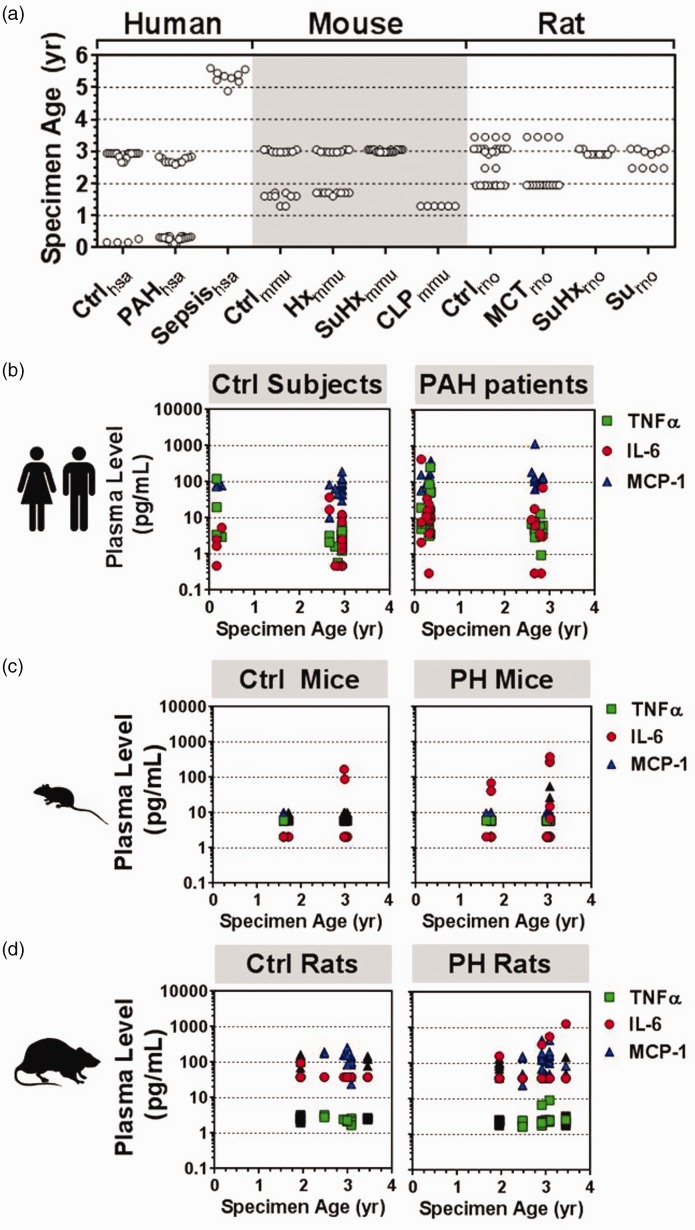
Fig. 4.
Plasma specimen age at time of cytokine measurement. (a) Distribution of specimen age according to species (hsa, mmu, rno) and specific exposure condition (n = 58–62 participants/animals per species group). Ctrl, PAH, MCT, SU5416 (Su), SU5416 and hypoxia (SuHx), hypoxia (Hx), CLP model of sepsis. (b–d) Plasma cytokine levels versus specimen age. No significant correlations between cytokine level and specimen age were observed in human, mouse or rat samples.

