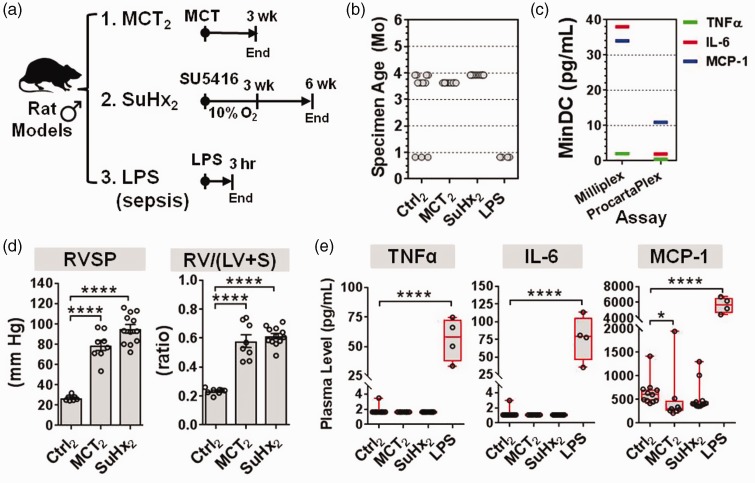
Fig. 5.
Validation of plasma cytokine levels in select rat models of PH. (a) Schematic overview of two different rat models of PH, and a LPS model of sepsis. PH was induced in rats by either MCT (n = 8 rats from one experiment), or SU5416 plus three weeks of hypoxia (SuHx; n = 12 rats from one experiment), and compared to controls at weeks 3 or 6 (Ctrl; n = 8 rats from two independent experiments). As a positive control, rats with LPS-induced sepsis were assessed 3 h post exposure (LPS n = 4, Ctrl n = 3 rats from one experiment). (b) Specimen age at the time of cytokine measurement was under 4 months. (c) Manufacturer’s specifications of minimum detectable concentrations (MinDC) for the Milliplex and ProcartaPlex brands of Luminex-based immunoassays. (d) RVSP and the right ventricle to left ventricle plus septum weight ratio confirm establishment of pulmonary hypertension (bar charts denote mean ± SEM). (e) Plasma levels of target cytokines measured by ProcartaPlex immunoassay. Boxplots denote median and interquartile range, and whiskers denote min/max values. Individual animals are shown as circles. Axes are split on graphs to more clearly show distribution of data. Statistical significance of RVSP and RV/(LV + S) was determined by one-way ANOVA and Dunnett’s multiple comparison test. Statistical significance of cytokine changes was determined by non-parametric Kruskal–Wallis with Dunn’s multiple comparison test. *P < 0.05, ****P < 0.0001 versus Ctrl group. Subscript 2 denotes new set of animals used in this validation experiment.

