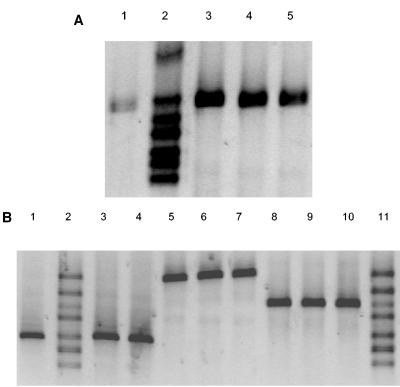
FIG. 5.
(A) DGGE patterns (32 to 41% denaturant) of the 350-bp phlD fragment amplified from DNA extracted from the rhizosphere of wheat colonized by the rifampin-resistant derivative of phlD+ isolate PWB532 representing DGGE group E. Based on dilution plating, isolate PWB532 was present at densities of approximately 5 × 10³ CFU/g of root (lane 1), 5 × 10⁴ CFU/g of root (lane 3), 5 × 10⁵ CFU/g of root (lane 4), and 5 × 10⁶ CFU/g of root (lane 5). Lane 2 contained a marker composed of phlD fragments amplified from DNA of seven isolates corresponding to DGGE groups G, E, F, C, Z, B, and I (from top to bottom). (B) DGGE patterns (32 to 41% denaturant) of 350-bp phlD fragments amplified from isolates PSC415 (DGGE group Z), Q8R1-96 (DGGE group G), and PPB3512 (DGGE group F) introduced into the sugar beet rhizosphere. Lane 1, DGGE group Z at a density of 5.3 × 10⁵ CFU/g of root; lane 2, marker; lane 3, DGGE group Z at a density of 2.7 × 10⁵ CFU/g of root; lane 4, DGGE group Z at a density of 1.5 × 10⁵ CFU/g of root; lane 5, DGGE group G at a density of 2.5 × 10⁶ CFU/g of root; lane 6, DGGE group G at a density of 7.6 × 10⁵ CFU/g of root; lane 7, DGGE group G at a density of 1.9 × 10⁶ CFU/g of root; lane 8, DGGE group F at a density of 8.5 × 10³ CFU/g of root; lane 9, DGGE group F at a density of 2.8 × 10⁴ CFU/g of root; lane 10, DGGE group F at a density of 2.4 × 10⁴ CFU/g of root; lane 11, marker. The marker consisted of phlD fragments amplified from DNA of seven isolates corresponding to DGGE groups G, E, F, C, Z, B, and I (from top to bottom).

