
Figure 4.
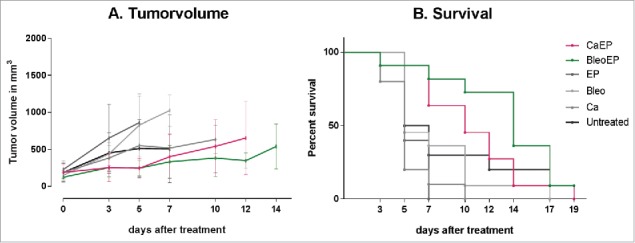
(A) Tumor response over time. NMRI-Foxn1nu mice randomized into treatment groups, CaEP = calcium electroporation, BleoEP = electrochemotherapy, Ca = calcium alone, Bleo = bleomycin alone, EP = electroporation alone, n = 11–12 (means + SD). After one treatment tumor volume was measured over time. The individual graphs terminates when n < 4. The difference in tumor volume between the six groups was not statistical significant (p = 0.07–1.0). (B) Survival curves from the same treatment groups show no statistical difference in survival between untreated mice and the five treatment groups (p = 0.06–0.8).