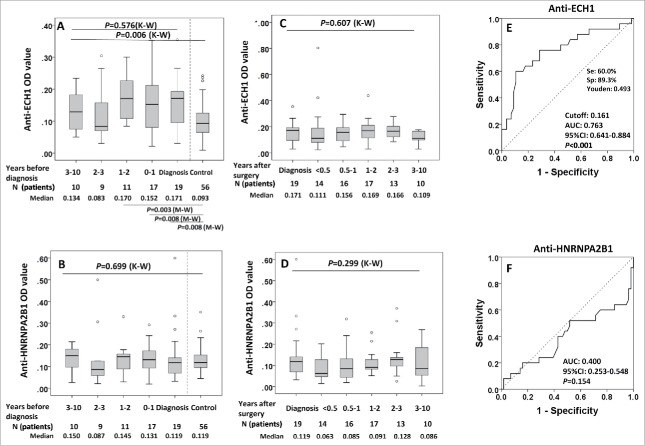
Figure 5.
Serial serum analysis of anti-ECH1 and anti-HNRNPA2B1 levels in discovery set 1 study groups. 5A and 5B: Longitudinal analysis of serum anti-ECH1 and anti-HNRNPA2B1 in LC patients at diagnosis and before diagnosis follow-up. Data are presented in quantile box plots. 5C and 5D: Longitudinal analysis of serum anti-ECH1 and anti-HNRNPA2B1 in LC patients at diagnosis, after diagnosis and surgery treatment follow-up. When there was more than one sample in a calendar year in a LC patient, we plotted the average OD for that year. 5E and 5 F: ROC curve of LC patients (n = 28) versus controls (n = 56) for autoantibody to ECH1 (5E) and HNRNPA2B1 (5F). For the patients with serial serum samples before diagnosis, the OD value form the serum samples with collection date closest to diagnosis was used for generating ROC. K–W: Kruscal–Wallis test for multiple groups; M–W: Mann–Whitney test for two groups.

