
Figure 3.
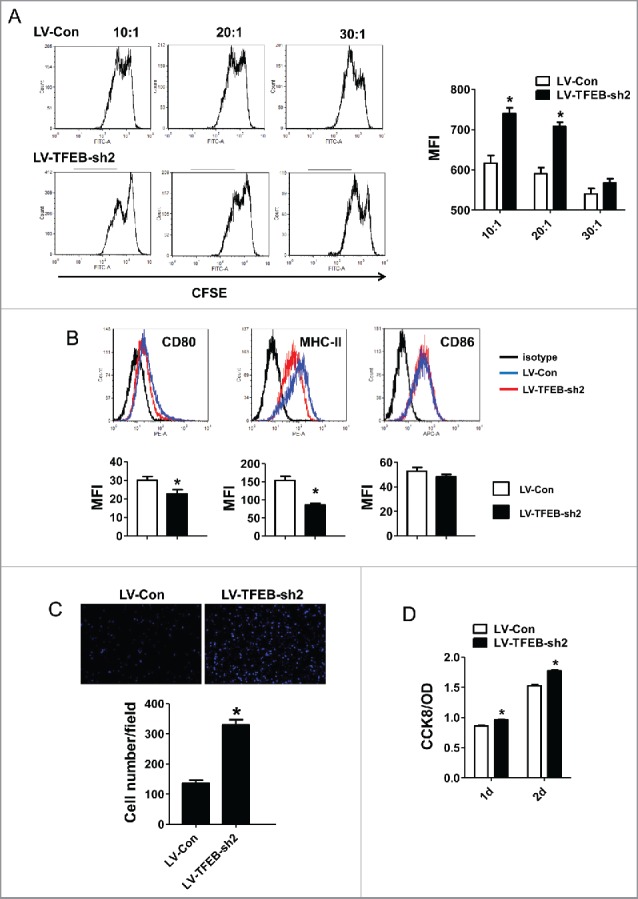
The effects of macrophage TFEB silencing on T-cell activation, proliferation, and tumor cell migration and proliferation. (A) Purified T-cells were labeled with CFSE, activated in vitro by CD3/CD28 and co-cultured with MΦs at the indicated T-cell:MΦ ratio for 60 h in the presence of EO771 TCM. Representative flow cytometry histograms (left) and quantitation (right) of T-cell proliferation as measured by dilution of CFSE are shown. *p < 0.05 vs. corresponding LV-Con group. (B) MΦs were transduced with control or TFEB shRNA lentiviruses and treated with LPS for 24 h. Cell surface CD86, CD80, and MHC II expression was measured by flow cytometry. Representative histograms (upper) and quantification of MFI (lower) were shown. *p < 0.05 vs. LV-Con. (C) TFEB knockdown enhanced the migration of EO771 cells. Transwell assays were performed as described in the Materials and methods section. (D) TFEB silencing in MΦs enhanced proliferation of tumor cells. EO771 cells were cultured in the presence of supernatant from LV-TFEB-sh2 or control virus transduced MΦs as described in the Methods.