
Figure 4.
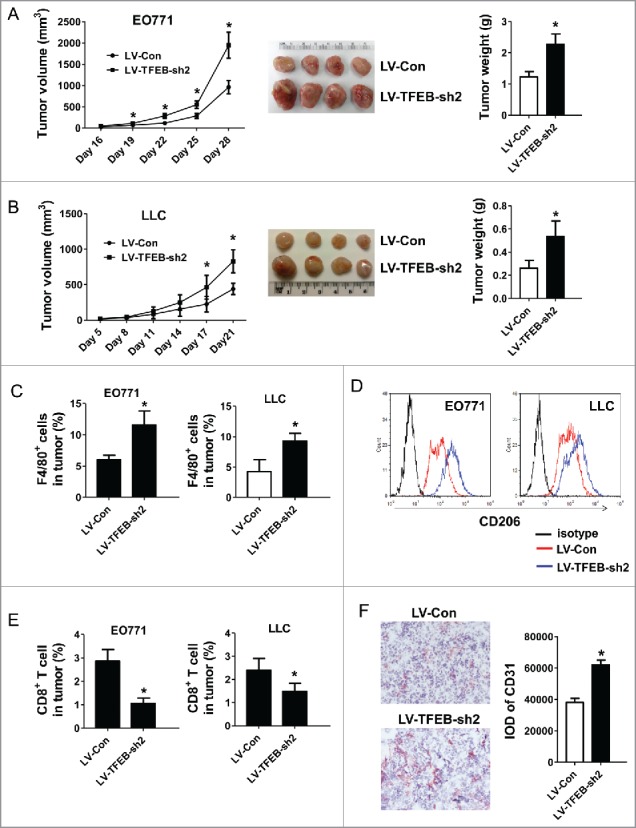
TFEB knockdown in macrophages promotes tumor growth in vivo. EO771 cells (A) or LLC cells (B) were injected into mice along with MΦs transduced with control or TFEB shRNA lentiviruses as described in the Materials and methods section. The tumor size was measured with a caliper at the indicated time points. Tumor volume is shown as mm3. The growth curve, representative images, and quantification of the primary tumors at the end-point are shown. Each data point represents the mean ± SD of eight mice (EO771) or five mice (LLC). *p < 0.05 vs. LV-Con; Student's t-test. (C) Percentage of F4/80+ MΦs in primary tumors at the end-point as determined by flow cytometry. *p < 0.05 vs. LV-Con; Student's t-test. Representative histograms are shown in Fig. S1A. (D) Flow cytometry analysis of CD206 expression in tumor infiltrating MΦs. (E) Percentage of CD8+ T cells in primary tumors at the end-point as determined by flow cytometry. Data are presented as the mean ± SD, *p < 0.05 vs. LV-Con; Student's t-test. Representative histograms are shown in Fig. S1B. (F) Representative immunohistochemical staining images and quantification of CD31 in EO771 tumor sections. *p < 0.05 vs. LV-Con; Student's t-test.