
Figure 6.
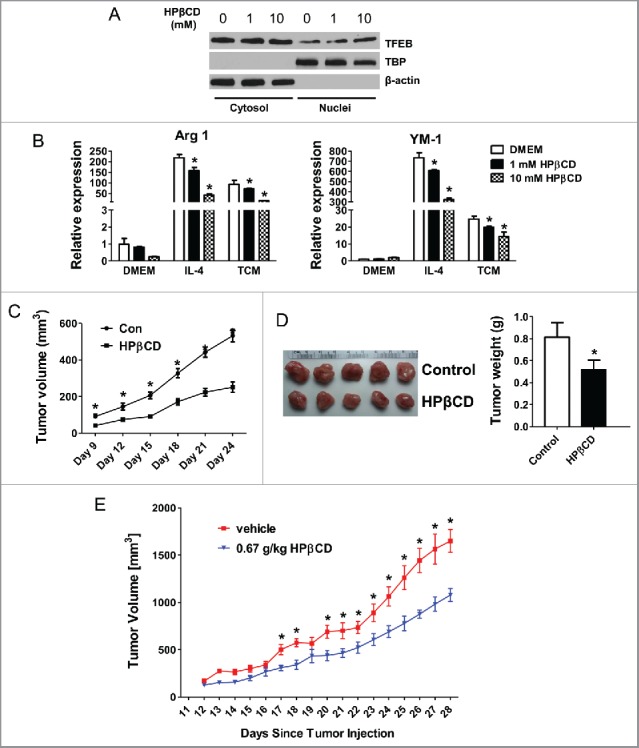
Activation of TFEB suppresses tumor growth in mice. (A) Western blot analysis of cytosolic and nuclear fractions obtained from MΦs treated with HPβCD for 24 h. (B) Expression of Arg1 and YM-1 in MΦs treated with IL-4 (15 ng/mL) or EO771 TCM with or without HPβCD for 24 h. (C) 4T1 cells and HPβCD-treated macrophages were co-injected into BALB/c mice. The tumor size was measured with a caliper at the indicated time points. Tumor volume is shown as mm3. Primary tumor growth curve is shown. Each data point represents the mean ± SD of 10 mice. *p < 0.05 vs. Con. (D) Representative images of primary tumors in mice at the end-point are shown (left); and tumor weight was measured and analyzed (right). (E) Effects of intraperitoneal administration of HPβCD on the tumor growth in Balb/c mice inoculated with 4T1 breast cancer cells (n = 10). Data are presented as the mean ± SD, *p < 0.05 vs. control; Student's t-test.