Figure 2.

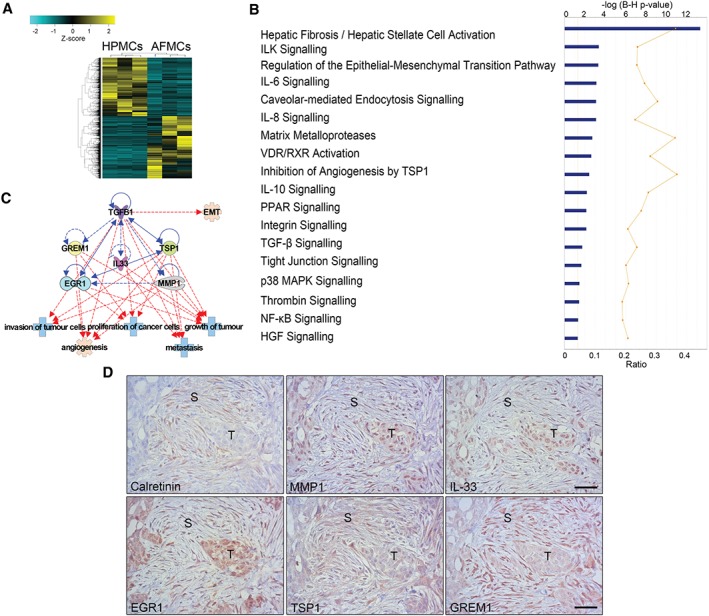
RNA sequencing analysis of AFMCs and protein validation in peritoneal metastasis biopsies. (A) Heat‐map representing the differentially expressed genes in control HPMCs (n = 3) and trans‐differentiated AFMCs (n = 3). (B) Significantly differentially regulated canonical pathways analysed with IPA software. The y‐axis indicates the statistical significance, calculated by use of the Benjamini–Hochberg correction [−log(P‐value) = 1.3]. The yellow threshold line represents this cut‐off. (C) Interactions between five molecules selected from upregulated genes in the dataset (MMP1, IL33, EGR1, TSP1, and GREM1) with TGF‐β1 (blue lines) and tumour‐related functions (red lines). Continuous lines represent direct relationships. Dotted lines represent indirect interactions. (D) A peritoneal implant of an OvCa biopsy reveals the presence of spindle‐like cells surrounding tumour micronodules, stained for calretinin, to indicate their mesothelial origin. Serial sections of the same case show marked staining for MMP1, IL‐33, EGR1, TSP1 and GREM1 overlapping with stromal areas where mesothelial‐derived fibroblastic cells accumulate. The same markers are also detected with variable intensity within the tumour parenchyma. S, stroma; T, tumour. Scale bars: 50 µm.
