
Figure 4.
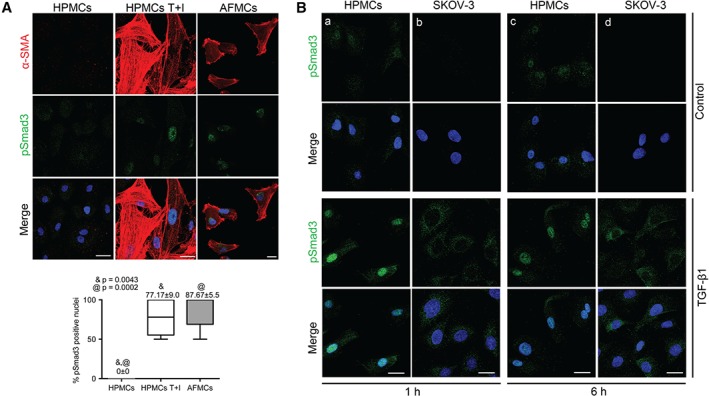
The TGF‐β1–Smad3 pathway is activated in AFMCs, and truncated in OvCa cells. (A) Double immunofluorescence staining for α‐SMA (red) and pSmad3 (green) in HPMCs T + I and AFMCs indicates Smad3‐dependent TGF‐β1 pathway activation in both in vitro and ex vivo trans‐differentiated MCs as compared with double‐negative control cells. Scale bars: 25 µm. pSmad3‐positive nuclei were quantified; the box plot represents mean ± standard error of the mean. Symbols represent the statistical differences between groups. (B) Treatment of HPMCs and SKOV3 cells with TGF‐β1 for 1 and 6 h. Immunofluorescence images show that, upon TGF‐β1 treatment, pSmad3 translocates to the nucleus in HPMCs (a, c) and remains cytoplasmic in OvCa cells (b, d). 4′,6‐Diamidino‐2‐phenylindole: blue. Scale bars: 25 µm.