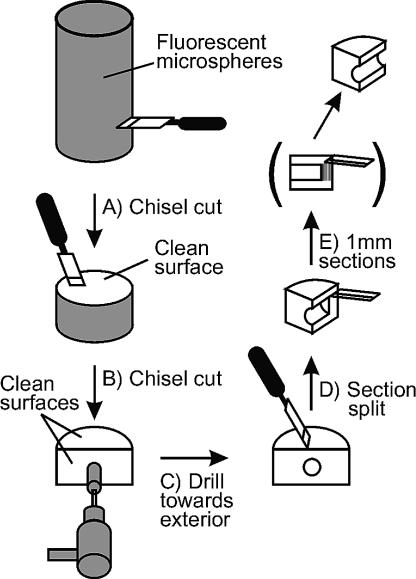
FIG. 1.
Schematic diagram of sample processing for fluorescent-microsphere penetration analysis. (A) Initial chisel cut exposing the first clean core surface is shown. (B) The second chisel cut in the center of the clean core surface created a second clean surface. (C) A clean, sterile 19-mm-o.d. drill bit was used to drill a hole in the center of the second clean surface. The hole was drilled until it was approximately 10 mm from the exterior surface. (D) A third chisel cut was made on the first clean surface, positioned to cleave the drill hole in half. (E) At this point, 1-mm-wide sections, starting from the core interior, were sampled by using clean, sterile razor blades and using the drill hole as a guide. The 1-mm-wide sections were placed in clean, sterile tubes and kept at −20°C until processing for microscopic analysis.

