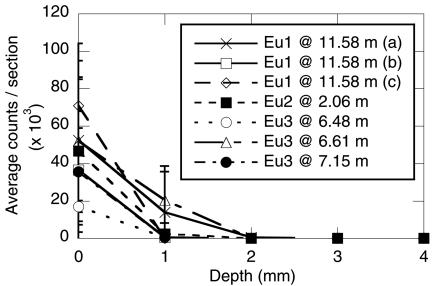
FIG. 4.
Microscopic examination of fluorescent-microsphere penetration. Average counts per section is the average number of fluorescent microspheres counted in 25 random fields for each 1-mm-wide section of each core sample. The samples are as described in Table 1. Error bars represent the standard deviation for 25 fields/1-mm-wide section.

