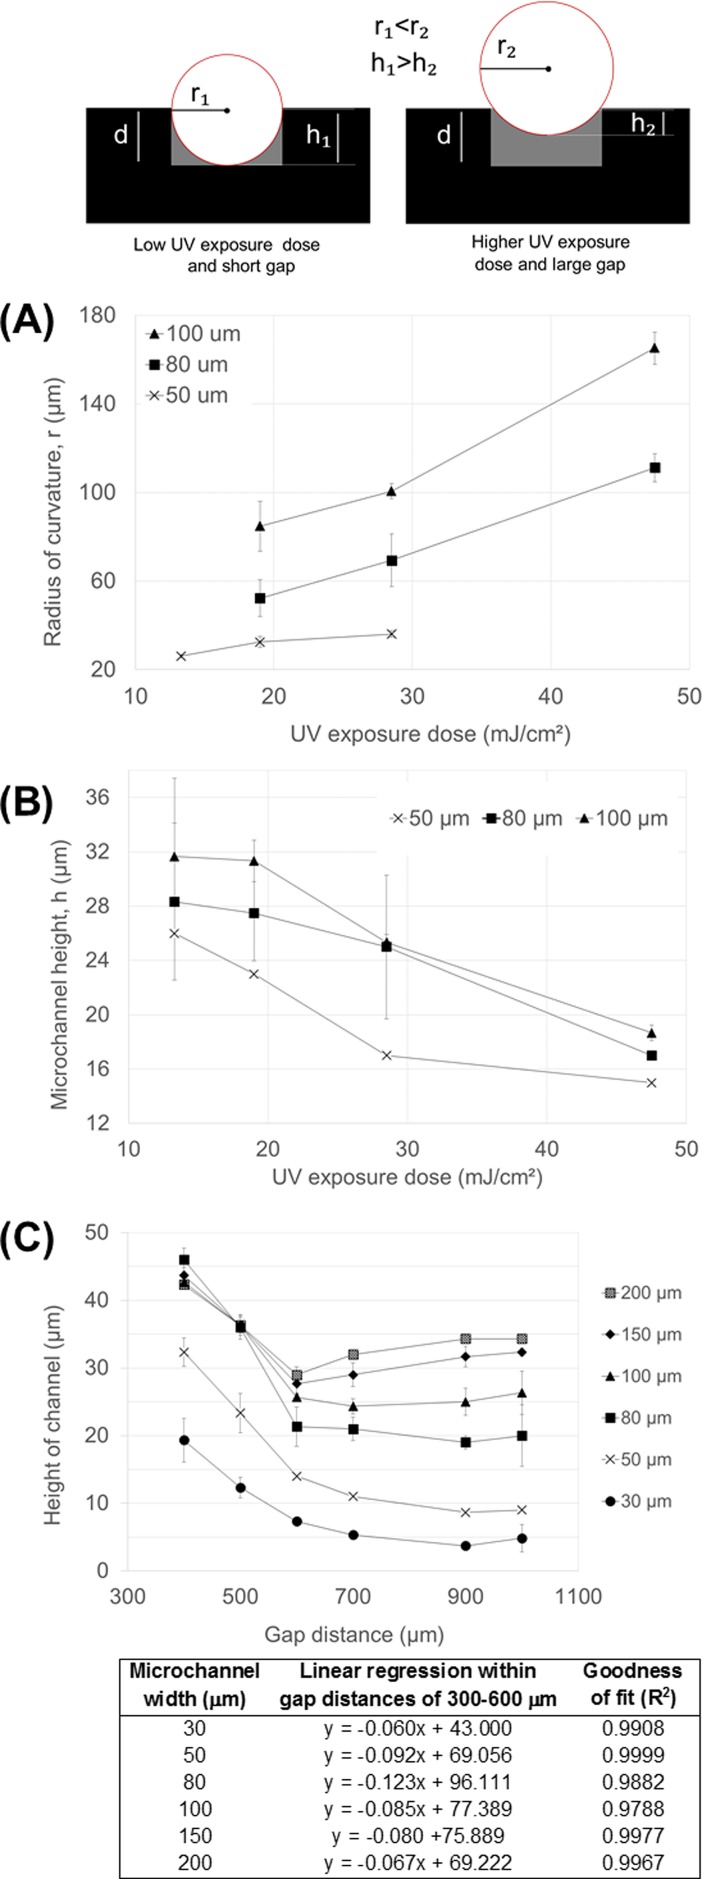
FIG. 3.
Illustration of the effects of the UV curing dose and the proximity gap on the microchannel radius of curvature (r) and height (h). Symbol d denotes the nominal thickness of the microchannel layer. The difference between the nominal thickness (d) and the measured height (h) is the residual layer thickness. (a) The microchannel radius of curvature (r) and (b) the microchannel height (h) as a function UV exposure dose. In all cases, Ormocomp® layer thickness was 35 μm, and the proximity gap during exposure was 400 μm. (c) The microchannel height (h) as a function of the distance of the proximity gap with linear regression analyses between gap distances 400 and 600 μm. The Ormocomp® layer thickness was 35 μm and the UV exposure dose was 19 mJ/cm2.

