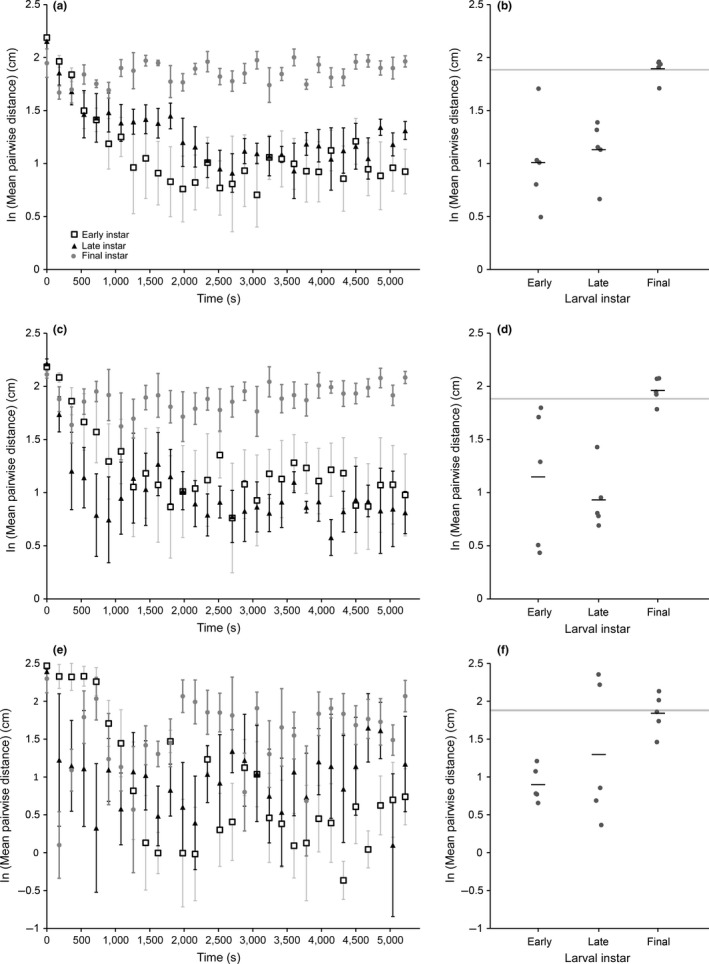
Figure 3.

Impact of group size and developmental stage on aggregative tendency. Log‐transformed pairwise distances (natural log) estimated from videos using eight (a, b), five (c, d), or two (e, f) larvae. In (a), (c), and (e), points are the mean (±SEM) average pairwise distances computed from a single time point (video frame) for a particular developmental stage: early‐feeding instars (open squares), late‐feeding instars (black triangles), nonfeeding instars (light gray circles). Note that pairwise distances tend to stabilize by ~2,000 s. In (b), (d), (e), each point represents the log‐transformed mean pairwise distance (natural log) calculated from a single video, following a 2,160‐s acclimation period. Horizontal bars represent the overall average for each life stage. The light gray bar in (b), (d), and (e) represents the 95% confidence interval for mean pairwise distance estimated via simulation under a model of random larval distribution for the respective number of larvae. Whereas early‐ and late‐feeding instars aggregate significantly more than the null model, final instars do not aggregate
