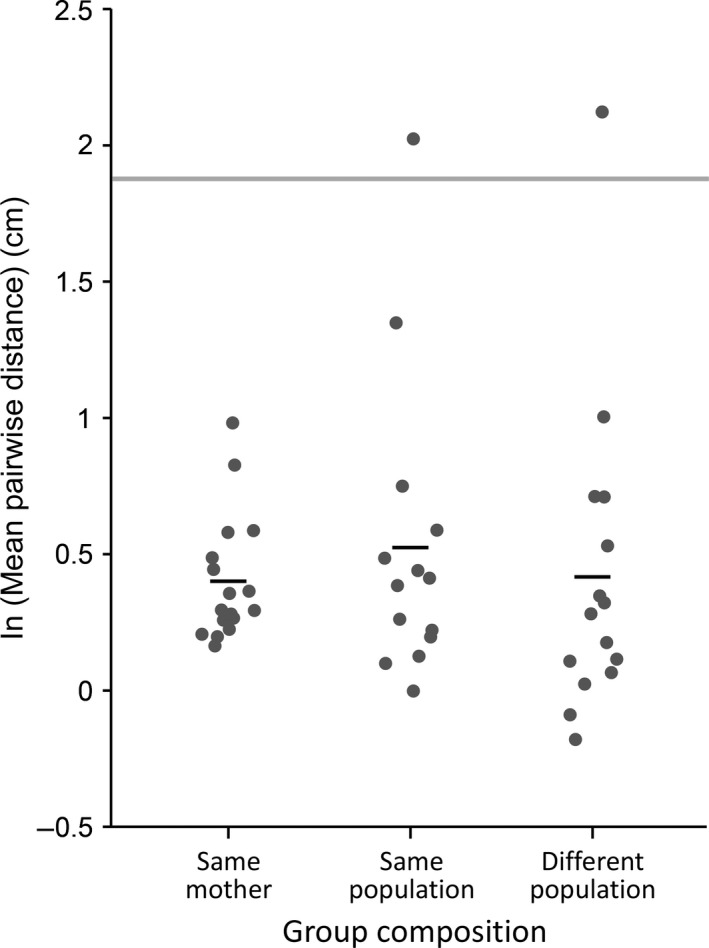
Figure 4.

Impact of relatedness on aggregative tendency. Each dark gray circle represents the log‐transformed (natural log) mean pairwise distances estimated from a single video of six late‐feeding instar larvae (following a 2,160‐s acclimation period), and black bars represent the overall mean for each treatment. The light gray bar represents the 95% confidence interval for the mean pairwise distance between six larvae estimated via simulation under a model of random larval distribution. Relatedness had no impact on larval aggregative tendency
