
Figure 6.
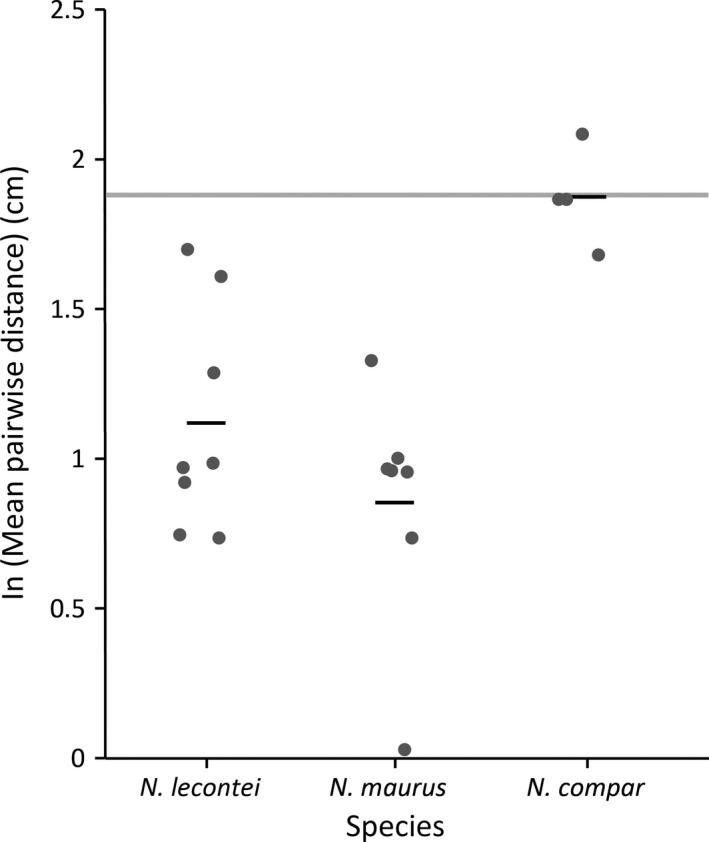
Interspecific variation in aggregative tendency. Each dark gray circle represents the log‐transformed (natural log) mean pairwise distances estimated from a single video of five late‐feeding instar larvae (following a 2,160‐s acclimation period); black bars represent the overall mean for each species (Neodiprion lecontei, Neodiprion maurus, and Neodiprion compar). The light gray bar represents the 95% confidence interval for the mean pairwise distance between five larvae estimated via simulation under a model of random larval distribution. Larvae of the two gregarious species, N. lecontei and N. maurus, were significantly more aggregative than the random model and larvae of the solitary species, N. compar