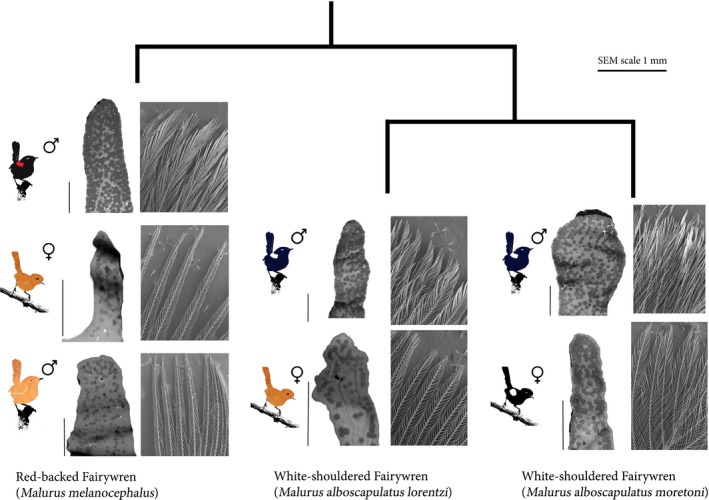
Figure 4.

Inferred phylogeny of included lineages based on Driskell et al. (2011) with illustrated phenotypes, SEM, and TEM images of representative crown barbules. Scale bar for all SEM images is shown above, 2μm scale bars for each TEM image is the vertical bar adjacent to each image. Left, note the overall similarity in cross section of melanosome (dark spots) distribution and density between all ornamented phenotypes compared to unornamented phenotypes. Right, note similarity in barbule density between ornamented female White‐shouldered Fairywrens and all unornamented phenotypes, in contrast to the highly dense and clustered ornamented male barbules
