
Figure 1.
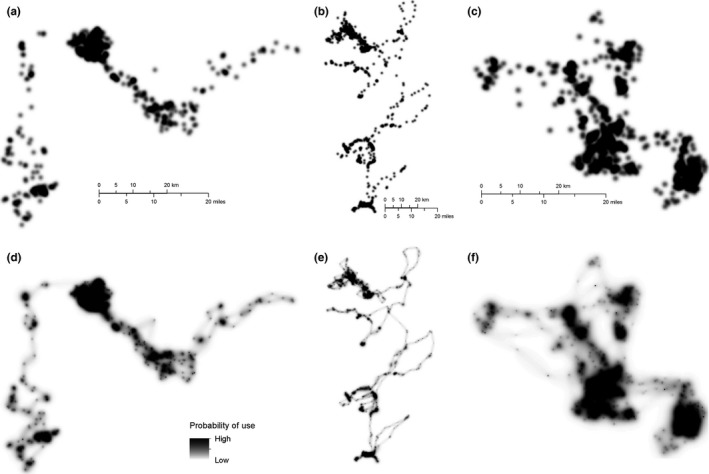
Estimated space use of three representative individual pumas. (a–c) Kernel density estimates using the adehabitat package for R (Calenge, 2006) (bivariate normal kernel, default smoothing method with smoothing parameter = 500). (d–f) Brownian bridge movement models calculated using the Brownian Bridge movement models (BBMM) package for R (Brownian motion variance parameter = 102.75 (d), 243.71 (e), 102.35 (f); location error = 26.2 m; maximum lag = 24 hr). Kernel density function parameters were selected to produce surfaces as similar as possible to the BBMM surfaces for comparison