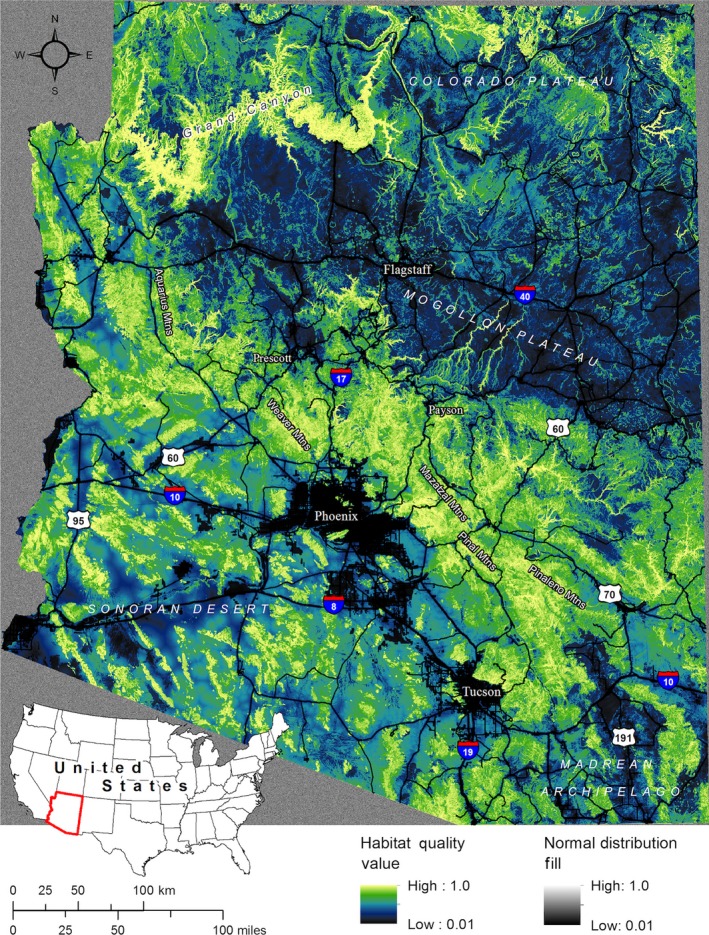
Figure 2.

Map of predicted habitat quality for puma movement across Arizona. Map edges were filled with values randomly selected from a normal distribution of habitat quality values to avoid edge effects when running wall‐to‐wall circuit theory models across the irregularly shaped state of Arizona, located in the southwest United States (inset). Quality values are displayed using a histogram‐equalized classification
