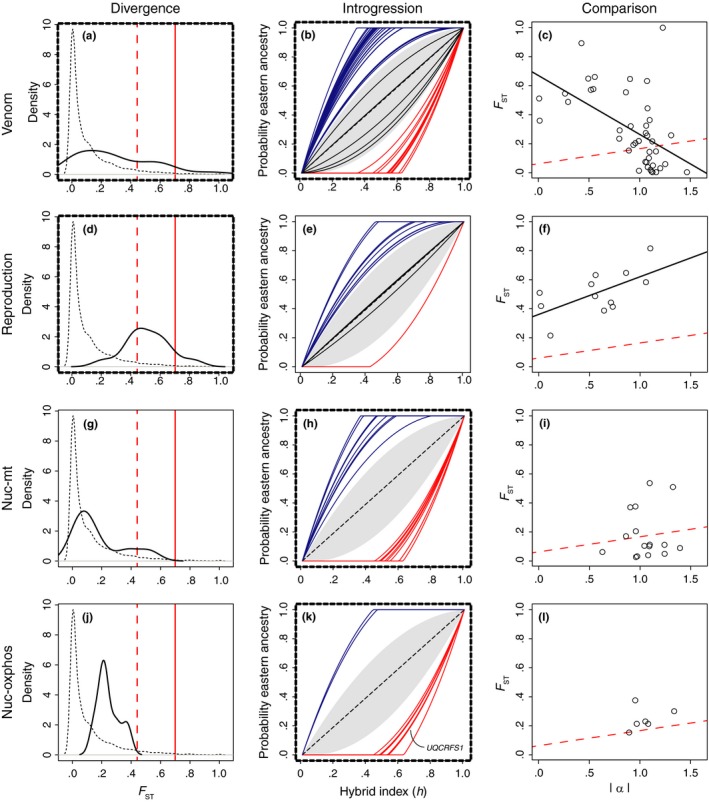
Figure 5.

Divergence and introgression of enriched venom (a–c), reproduction (d–f), nuc‐mt (g–i), and nuc‐oxphos (j–l) candidate gene sets. Panels with bold, dashed borders represent outlier locus sets statistically enriched for specific candidate genes. (a, d, g, j) Kernel density plots of candidate gene (black line) and genomewide (dashed line) FST estimates. Red dashed lines represent the 95th FST quantile and solid red lines represent the 99th FST quantile. (b, e, h, k) Genomic clines of candidate genes with excess ancestry. The gray shaded region represents the genome background and is bounded by the positive and negative means of α. Bold colored lines represent outlier locus clines with evidence of excess eastern (blue) and western (red) ancestry. Black clines were candidate gene loci without evidence of excess ancestry. In panel k (nuc‐oxphos genes), the locus‐specific cline for UQCRFS1 is labeled. (c, f, i, l) Comparisons of locus‐specific |α| and FST values for candidate gene sets. The trend lines in (c) and (f) depict statistically significant correlations. The red dashed lines depict the background genome correlation between FST and |α|, for comparison
