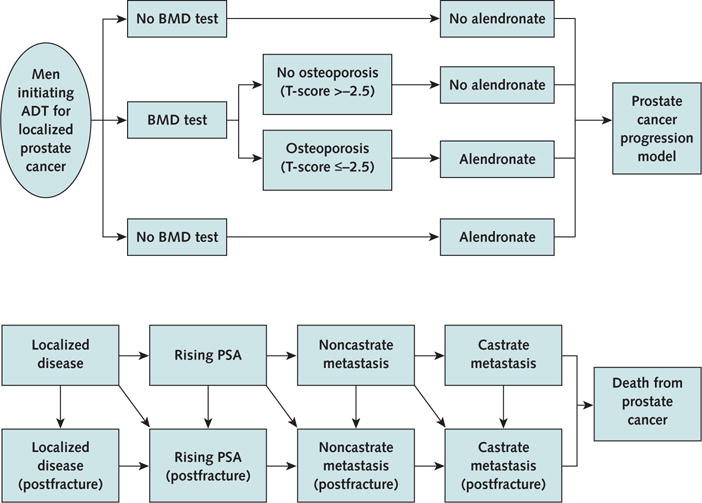
Figure. Clinical strategies and progression model for prostate cancer.

ADT = androgen deprivation therapy; BMD = bone mineral density; PSA = prostate-specific antigen. Top. Algorithm showing a decision made at the onset of ADT for localized prostate cancer. Patients assigned to the alendronate group received alendronate for 5 years after proceeding to the prostate cancer progression model. Bottom. Prostate cancer progression model. Patients enter the model with localized disease. Each year, patients are at risk for the progression of prostate cancer, the occurrence of a hip fracture, or both. Throughout the patients’ lifetime, all patients are at risk for death from causes unrelated to prostate cancer (not shown by the state or arrows). Squares represent the health states in the model. Arrows represent transitions between health states.
