Fig. 2.

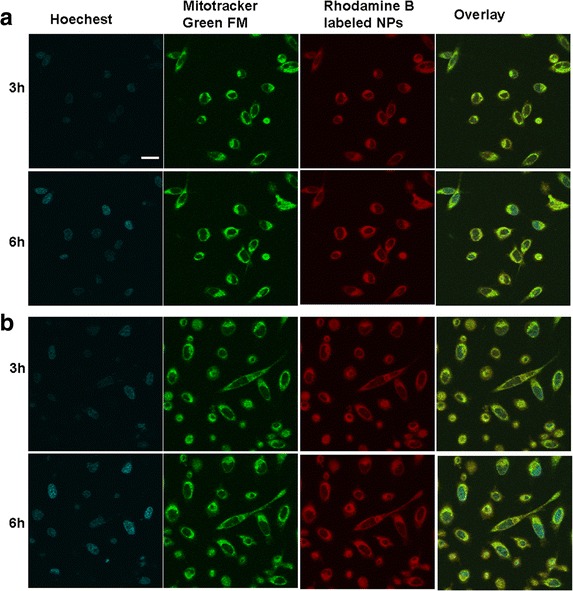
The in vitro cellular distribution of BSA NPs after being incubated with different tumor cells. Fluorescent image of SMMC-7721 cells (a) and Plc cells (b). Scale bar, 100 μm

The in vitro cellular distribution of BSA NPs after being incubated with different tumor cells. Fluorescent image of SMMC-7721 cells (a) and Plc cells (b). Scale bar, 100 μm