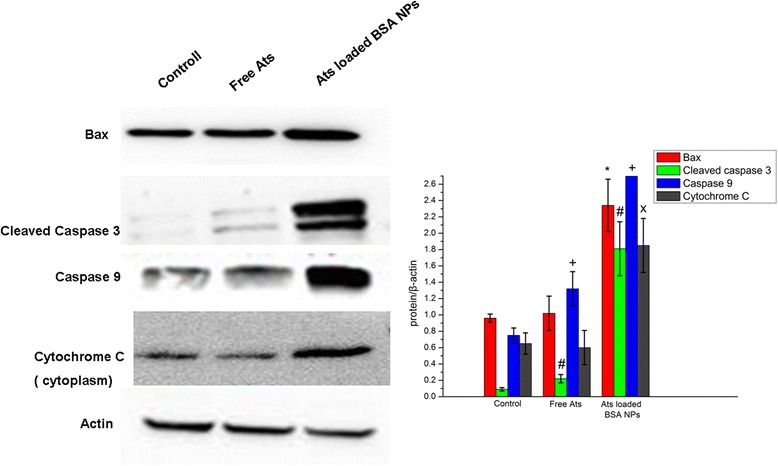
Fig. 6.

Western blot analyses of the expression levels of cleaved caspase-3, caspase-9, Bax, and cytochrome C in SMMC-7721 cells. *P < 0.05 versus the Bax protein expression of the control group; # P < 0.05 versus the cleaved caspase-3 expression of the control group; + P < 0.05 versus the caspase-9 protein expression of the control group; x P < 0.05 versus the cytochrome C protein expression of the control group. Data were presented as the mean ± SD (n = 3)
