
Figure 2.
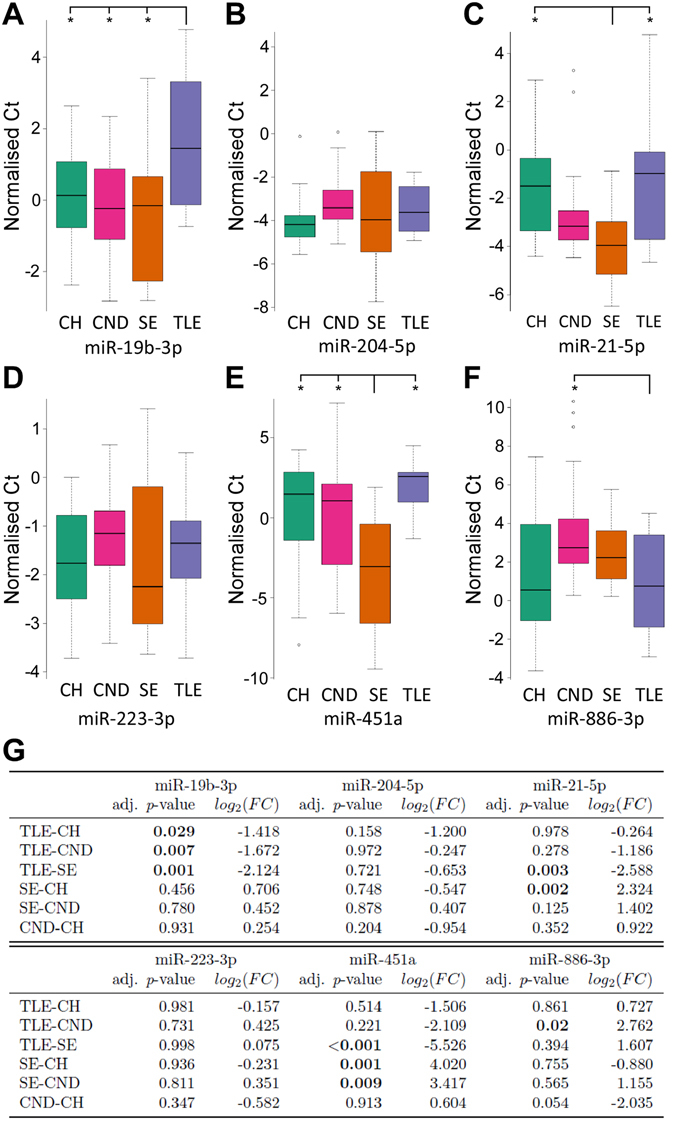
Validation of microRNA. (A–F) Boxplots showing the distribution of normalised Ct following Taqman individual microRNA assays of miR-19b-3p, miR-21-5p, miR-204-5p, miR-223-3p, miR-451a and miR-886-3p in each of the four sets of samples: CH (N = 25), CND (N = 25), SE (N = 16) and TLE (N = 14). Note, the data shown are normalized and the lower the value the greater the relative expression of the microRNA. Outliers not graphed for purposes of data presentation are shown as circles. (G) log2(FC) and adjusted p-value for validated microRNA. CH: controls with headache, TLE: temporal lobe epilepsy, SE: status epilepticus, CND: controls with other neurological diseases.