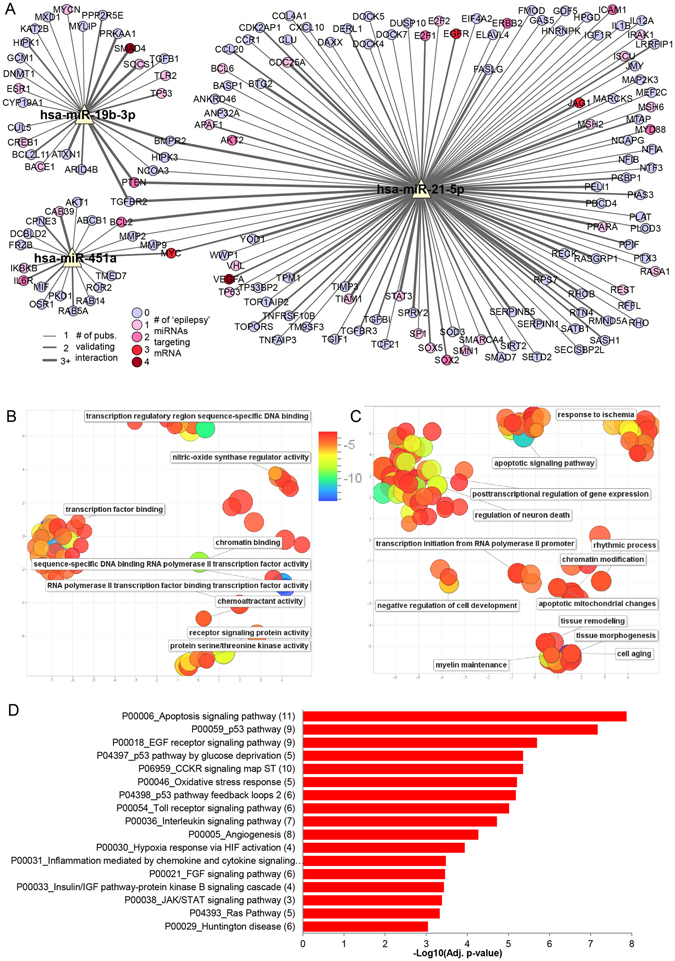
Figure 7.

MicroRNA target prediction and pathway enrichment analysis. (A) MicroRNA-Target Interaction Network showing targets with strong experimental evidence from miRTarBase for miR-19b-3p, miR-21-5p and miR-451a. Edge thickness corresponds to the number of publications that validated the miRNA-mRNA interaction. Pink/red coloured targets are also targets of one or more of the functionally-validated epilepsy-associated microRNAs (see Materials & Methods). The network was generated using Cytoscape software. (B,C) Removal of GO term redundancy and semantic visualisation of the significantly associated GO molecular function (B) and biological processes (C) (adjusted p-value < 0.05) using REVIGO. The scatterplot shows the cluster representatives (i.e. terms remaining after the redundancy reduction) in a two dimensional space derived by applying multidimensional scaling to a matrix of the GO terms’ semantic similarities (the axes have no intrinsic meaning). Bubble colour indicates the log10(adjusted p-value) (legend in upper right-hand corner of B); size indicates the frequency of the GO term in the underlying Homo sapiens database (bubbles of more general terms are larger). (D) Bar plot showing the −log10(adjusted p-value) of significantly enriched (adjusted p-value < 0.001) PANTHER pathways for validated targets of miR-19b-3p, miR-21-5p and miR-451a. The number of targets in a given pathway is shown in parentheses.
