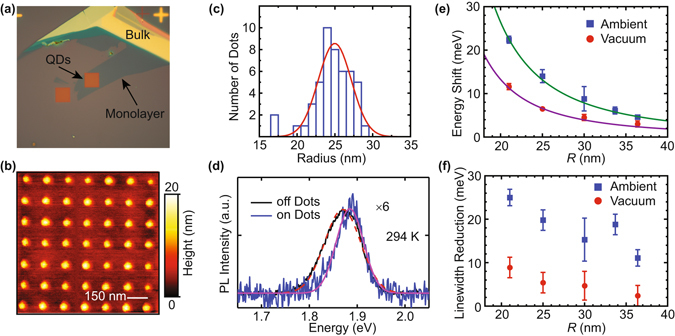
Figure 2.

(a) Optical image of a nanopatterned sample. A 12 μm × 12 μm square of the ML MoS2 flake is processed into laterally confined nanodots. (b) AFM scan of a 1 μm × 1 μm region of patterned nanodots with dot spacing of 150 nm. (c) Nanodot size distribution from the AFM scan in (a). The size distribution is characterized by a normal distribution (red). For the sample shown, the average radius is R = 25 nm with a standard deviation of 3 nm. (d) PL spectra of nanodots (on dots, blue) and the continuous ML (off dots, black) from a single ML flake. (e) Size dependent exciton energy shift measured in ambient (blue square) and vacuum (red circle) conditions. (f) Linewidth reduction of nanodots measured in ambient (blue square) and in vacuum (red circle) conditions. All data in this figure are at room temperature.
