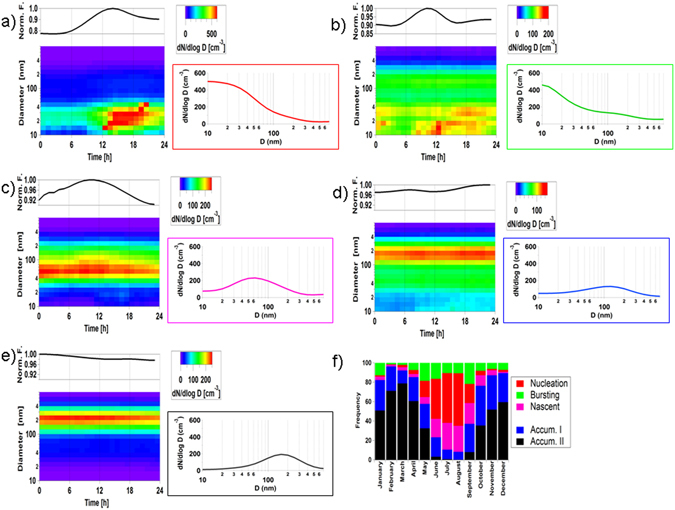
Figure 1.

(a–e) Daily aerosol size distributions cluster results (bottom), average Daily N10–500 particle number concentration (top) and average daily size distribution (on the right coloured panel); and (f) annual frequency distributions of the five aerosol categories. New particle formation events were also validated by N3–10nm concentrations (measured by tandem particle counters with lower detection limits of 3 and 10 nm, respectively; see methods) of 316 ± 110, 168 ± 58, 128 ± 44, 73 ± 25, 99 ± 36 cm−3 for clusters (a–e), respectively.
