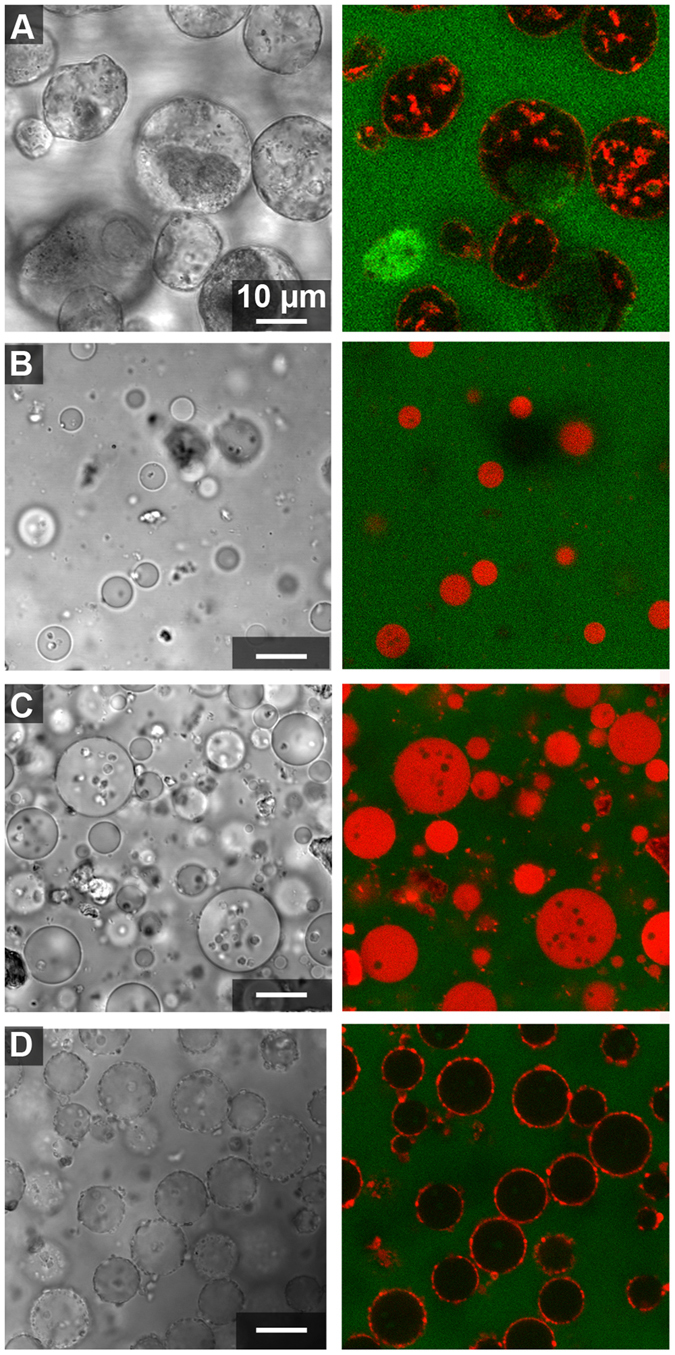
Figure 5.

Clay distribution in ATPS with higher polymer concentration. Optical microscope images showing clay particles with 20:1 volume ratio of a stock 20%/20% w/w PEG/Dx ATPS. Left-hand images show transmitted light, and right-hand images show overlay of red and green confocal fluorescence channels for samples containing: (A) Kaolinite, (B) Na-rich montmorillonite, (C) Ca-rich montmorillonite and (D) illite. Fluorescent-labeled Dx (red) and PEG (green) have been included to aid visualization of the Dx-rich phase droplets and PEG-rich continuous phase.
