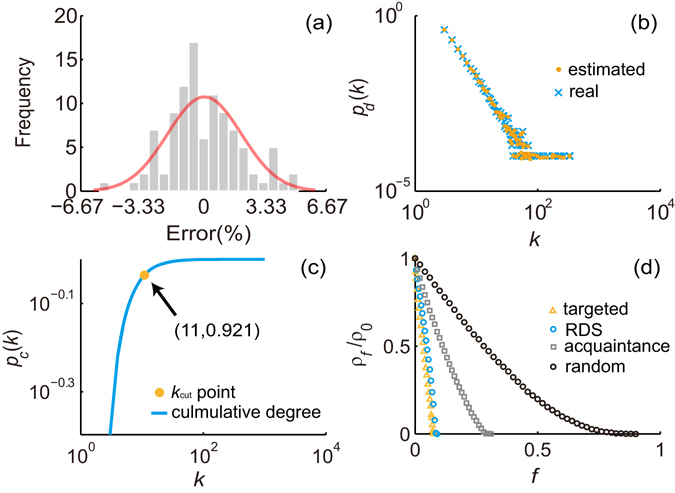
Figure 2.

Basic results of BA network. (a) The error distribution of estimated average degree. (b) The average of estimated degree distributions and the real degree distribution. (c) The cumulative degree distribution obtained from the estimated degree distribution of one simulation. In this simulation, the value of k cut is 11. (d) Reduced prevalence ρ f/ρ 0 from simulations of the SIS model on the BA network with random strategy, acquaintance strategy, targeted strategy and RDS strategy, at a fixed spreading rate λ = 0.25. The prevalence is averaged over 100 simulations.
