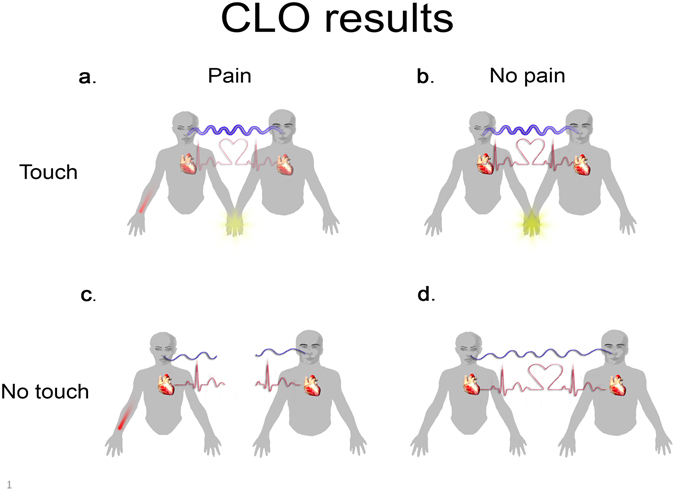
Figure 3.

Graphical representation of Coupled Linear Oscillator (CLO) model findings for heart rate and respiration (Fig. 2). Blue lines represent respiration inter-partner coupling and red lines represent coupling in heart-rate. The line’s thickness represents the strength of the coupling, with broken lines denoting a total lack of the coupling. (a) Coupling of respiration and heart rate during touch-pain condition. (b) Coupling of respiration and heart rate during touch-no pain condition. (c) No coupling of respiration and heart rate during no touch-pain condition. (d) Coupling of respiration and heart rate during no touch-no pain condition.
