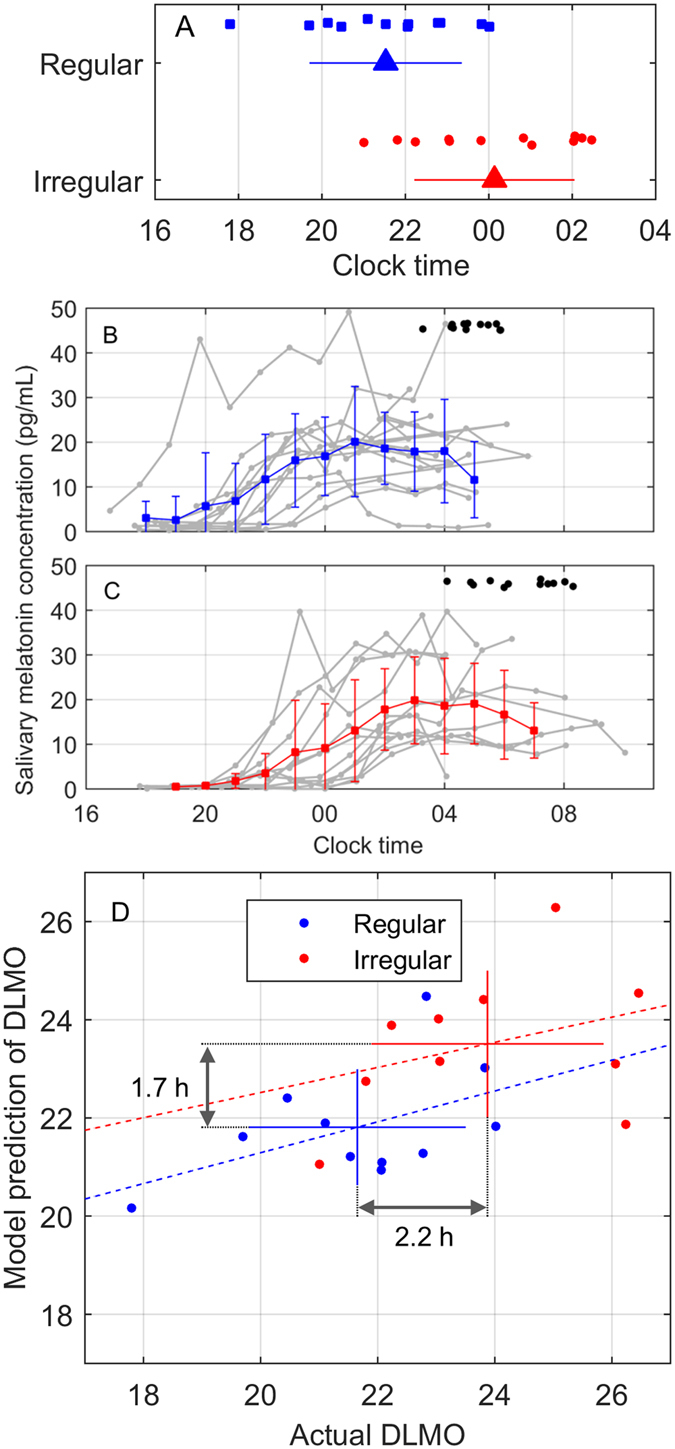
Figure 3.

Melatonin secretion is delayed in Irregular sleepers. Top panel: (A) Timing of salivary dim light melatonin onset (DLMO) for Regular (n = 12) and Irregular (n = 12) groups. Individuals in each group are shown as dots, with y-axis position jittered for visibility. Groups means (triangles) and standard deviations (error bars) are shown. Middle two panels: Time course for salivary melatonin concentration are shown for Regular participants in (B) and Irregular participants in (C), along with average sleep midpoint times for the nighttime sleep block for each individual (black dots), with y-axis position jittered for visibility. Gray lines show individuals in 1-h bins. Colored lines with error bars show group mean and standard deviation in 1-h bins. Bottom panel: (D) Actual timing of DLMO vs. model prediction for timing of DLMO, assessed using saliva. Data points correspond to individuals in the Regular (blue square) and Irregular (red circle) groups. Error bars show mean and standard deviation for each group. Differences in group averages are displayed. The dashed lines show linear regressions for each group.
