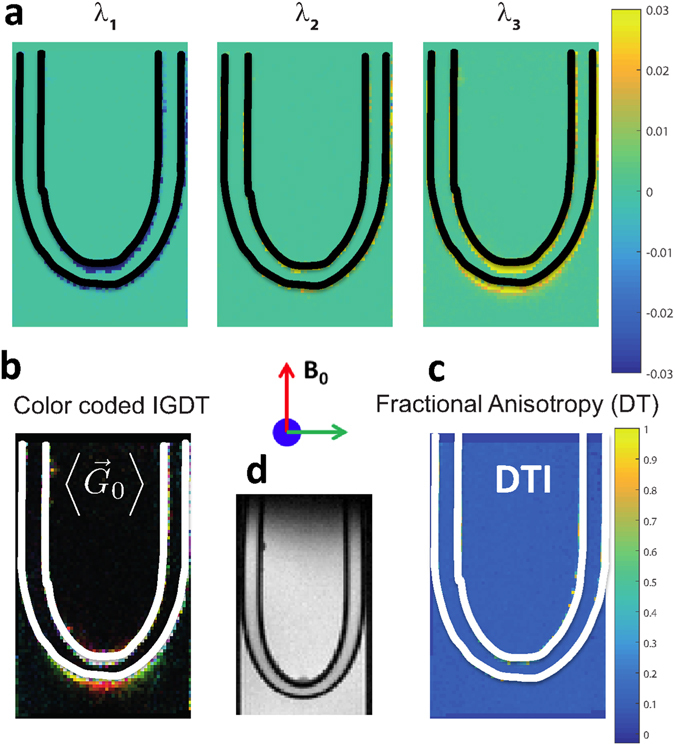
Figure 3.

Mapping the average background gradient in a water phantom incorporating a rubber “U-tube”, also filled with water (see panel (d) for a magnetic resonance image of the analyzed object). (a) Images of the eigenvalues determined for the IGDT using six non-collinear directions [1, 1, 0], [−1, 1, 0], [0, 1, −1], [0, −1, −1], [1, 0, −1], [−1, 0, −1]. A black mask was applied on the position occupied by the tube. Since the sample is relatively uniform most eigenvalues are null; only in the proximity of the “U” bend do spins feel the susceptibility distortions, originating the non-null eigenvalues λ 3 appearing yellow in the proximity of the bend. Other eigenvalues are indistinguishable from 0; λ 3, the eigenvector with the largest eigenvalue, is therefore in essence a vector that defines the orientation of the average background gradient. (b) Color-coded orientation maps arising from this average background gradient [red: z-axis (up-down), blue: x-axis (in-out), green: y-axis (left-right)]. Parameters for these NOGSE MRI measurements were: N = 8, G = 21 G/cm, TE NOGSE = 10 ms; spatial resolution =125 × 125 × 1000 (μm)3; repetition and echo times TR/TE = 500/28 ms, number of averages NA = 8. (c) The DTI tensor determined from the sNOGSE amplitude modulation Δβ S was used to calculate and plot its fractional anisotropy where and λ i are the three DTI eigenvalues, showing no information as diffusion is in this instance isotropic in all positions. A white mask was also applied in the latter two panels. An EPI acquisition sequence1 was used for the all images; the typical SNR was >100 at its lowest. A full set of measurements took <2 min to acquire.
