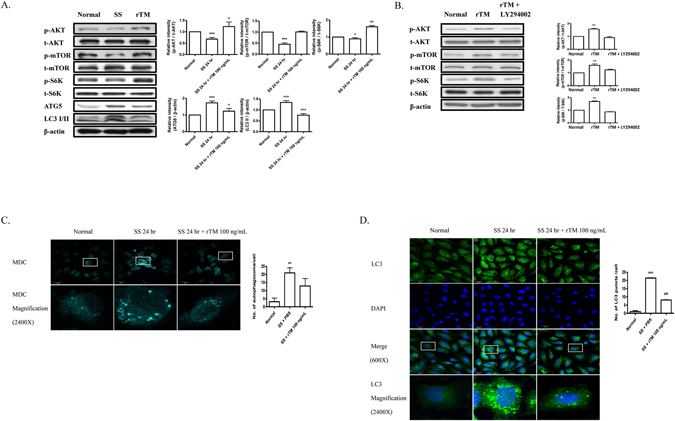
Figure 1.

rTM suppresses serum starvation-induced autophagy in ECs. (A) Western blot analyses were performed in ECs without SS (Normal), with SS (SS) or SS + rTM 100 ng/mL (rTM). Bar graphs showed the ratios of protein expression levels at 24 hr in ECs of SS or rTM group to normal group. Data are shown as mean ± SEM (n = 3). *p < 0.05, **p < 0.01 and ***p < 0.001 vs. cells without SS (Normal). (B) Western blot analyses were performed in ECs treated with rTM 100 ng/mL or rTM + AKT inhibitor, LY294002 10 mM for 24 hr. Bar graphs showed the ratios of protein expression levels in cells with rTM or rTM + LY294002 to saline treatment (Normal). Data are shown as mean ± SEM (n = 3). **p < 0.01 vs. cells with saline treatment (Normal). (C and D) Immunofluorescence staining of autophagosomes with MDC (C) and LC3 (D) in cultured ECs with normal condition without SS (Normal), with SS + phosphate buffered saline (PBS) and with SS + rTM 100 ng/mL treatment. DAPI was used to stain the nuclei of ECs. Magnified view (2400X) of a representative cell was shown. Bar = 30 μm. Bar graphs showed the quantification of MDC-positive dot staining (C) or LC3 puncta per cell (D). Ten cells were counted and averaged for each labeling condition. Data are mean ± SEM. **p < 0.01, ***p < 0.001 compared with cells under normal condition without SS. ###p < 0.001 compared with cells under SS for 24 hr.
