
Figure 2.
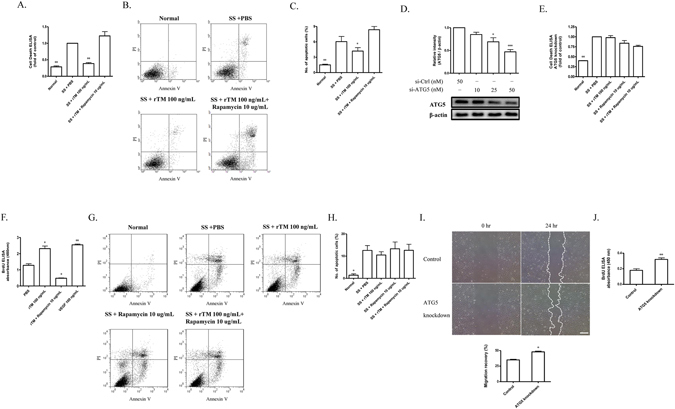
Autophagy plays a role in rTM effect on ECs. (A and E) Normal (A) and ATG5 knockdown (E) ECs received various indicated treatment. Apoptosis was determined with a cell death detection ELISA kit. The data were expressed as absorbance ratios of various indicated treatment to SS + PBS treatment. Data are shown as mean ± SEM (n = 3). **p < 0.01 vs. cells with SS + PBS treatment. (B and C; G and H) Apoptosis in normal (B) and ATG5 knockdown ECs (G) was also determined with a FITC annexin V apoptosis detection kit with flow cytometry. The representative pictures from each group were shown (B and G). The data were expressed as the percentage of apoptotic cell count (Annexin V-FITC positive and PI positive)/total cell count (C and H). All results were obtained from three independent experiments. Data are shown as mean ± SEM (n = 3). *p < 0.05 and **p < 0.01 vs. cells with SS + PBS treatment. (D) ECs were transfected with control siRNA (si-Ctrl) and ATG5 siRNA (si-ATG5). The knockdown efficiency of ATG5 in ECs was measured by western blot. Data are shown as mean ± SEM (n = 3). *p < 0.05 and ***p < 0.001 vs. cells with si-Ctrl transfection. (F) Cell proliferation was measured in ECs received various indicated treatment. Data were expressed as BrdU absorbance and shown as mean ± SEM (n = 3). *p < 0.05, **p < 0.01 vs. cells with PBS treatment. VEGF was used as a positive control. (I and J) Migration and proliferation ability were compared between ECs with and without ATG knockdown (control transfection). Representative photomicrographs of the ECs migration during wound healing assay were shown (I; left panel). Cultured ECs were wounded with pipette tips. The migration ability was expressed by the percentage of distance at 24 hr/0 hr (I; right panel). Bar = 500 μm. (J) Proliferation ability was measured with BrdU assay. Data are shown as mean ± SEM (n = 3). *p < 0.05, **p < 0.01 vs. cells without ATG5 knockdown (control).