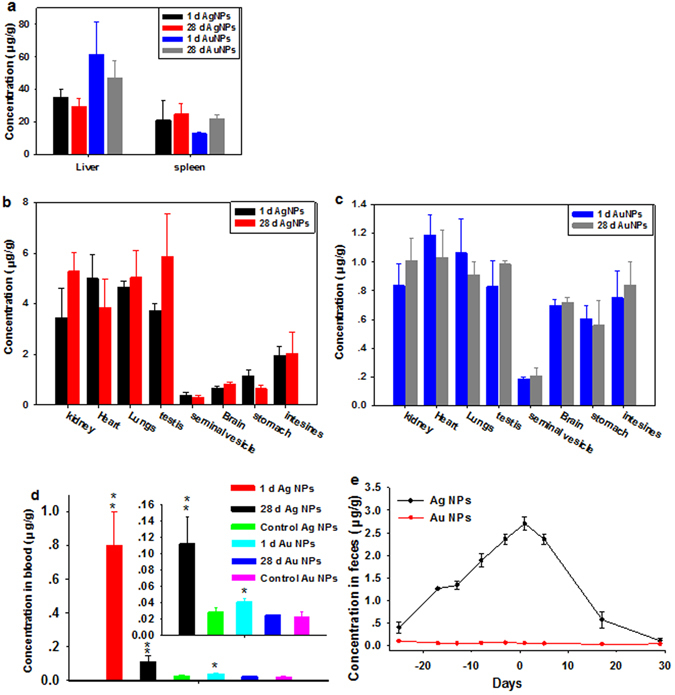
Figure 3.

AgNPs or AuNPs levels in animal tissues (a–c), blood (d) and feces (e) as indicators of inorganic NPs biodistribution, circulation and elimination at serial time points. These results show mean and standard deviation, n = 5. a Exhibits the contents of AgNPs or AuNPs in the liver and spleen at both time points, b and c exhibit the contents of AgNPs or AuNPs in the other organs at both time points, respectively. Day −25 to day 0 are the time interval during which the NPs were administered.
