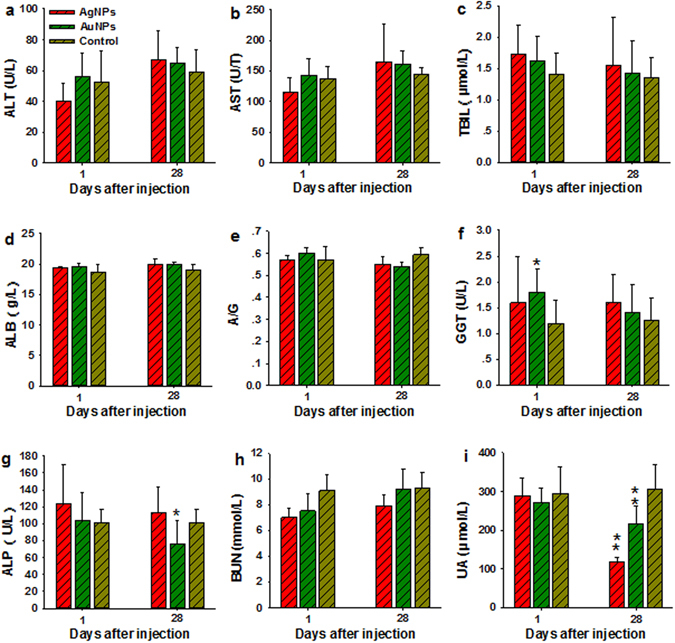
Figure 4.

Serum biochemical analysis from animals treated with AgNPs and/or AuNPs and control. (a–i) Results exhibit mean and standard deviation of ALT (a), AST (b), TBIL (c), ALB (d), A/G (e), GGT (f), ALP (g), BUN (h), and UA (i). Abbreviations: alanine aminotransferase, ALT; aspartate aminotransferase, AST; total bilirubin, TBIL; albumin, ALB; the ratio of albumin to globulin, A/G; gamma glutamyl transaminase, GGT; alkaline phosphatase, ALP; blood urea nitrogen, BUN; and urea, UA, n = 5.
