Figure 7.

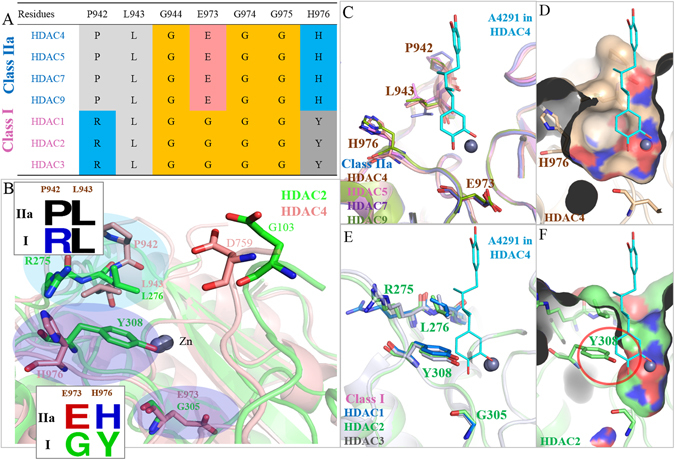
Comparison of Class I and Class IIa HDAC cavities. (A) Sequence alignment of residues within the catalytic site of class I (pink) and class IIa (blue) HDAC isozymes as shown. Residue numbering for HDAC4 is located on top. (B) Structural alignment of HDAC2 (green) and HDAC4 (brown) with different residues (boxes) are shown at designated positions. Blue circles highlight residue differences. (C) Stick model of class IIa isozymes are aligned with inhibitor A4291 (blue) docked from HDAC4. (D) The surface model of the HDAC4 active site is superimposed with inhibitor A4291 to show the relative cavity size. (E) Stick model of class I isozymes aligned with inhibitor A4291 (blue) docked from HDAC4. Enzymes are labeled as shown. (F) The surface model of HDAC2 (green stick model) is superimposed with inhibitor A4291 docked from HDAC4 (blue). Location of residue Y308 is indicated by red circle. Note the reduced space within the active site due to Y308. Zinc is indicated by grey sphere.
