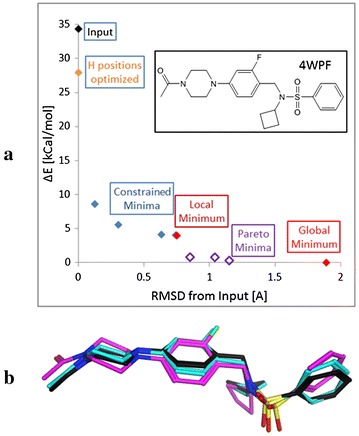
Fig. 2.

Conformational analysis of the sulfonamide ligand in the 4WPF PDB crystal structure performed with sdfMMConfAnalysis. a Profile of conformations returned. RMSD values on the x axis are relative to the input conformation. Energies on the y axis are relative to the global minimum. b Three conformations from the conformation analysis. The input conformation is in black, the constraint minimum at 0.3 Å from the input is in blue and the Pareto minimum at 0.8 Å from the input is shown in pink
