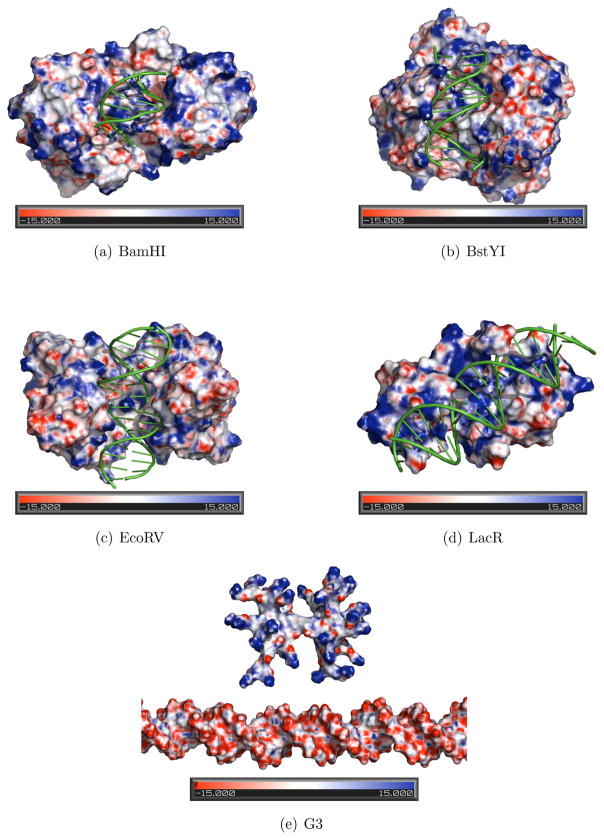
Figure 3.
Electrostatic potential surfaces as calculated with PBEQ module of CHARMM shown for proteins: (a) BamHI (PDB ID 1ESG); (b) BstYI (PDB ID 2POJ); (c) EcoRV (PDB ID 2RVE); and (d) Lac Repressor (PDB ID 1OSL) complexed with DNA nonspecifically; and (e) G3. Images were made by PyMOL. Negative regions are shown with red, and positive regions are shown with blue. Heat map color scale is from −15.0 kT/e to 15.0 kT/e.

