
Figure 2.
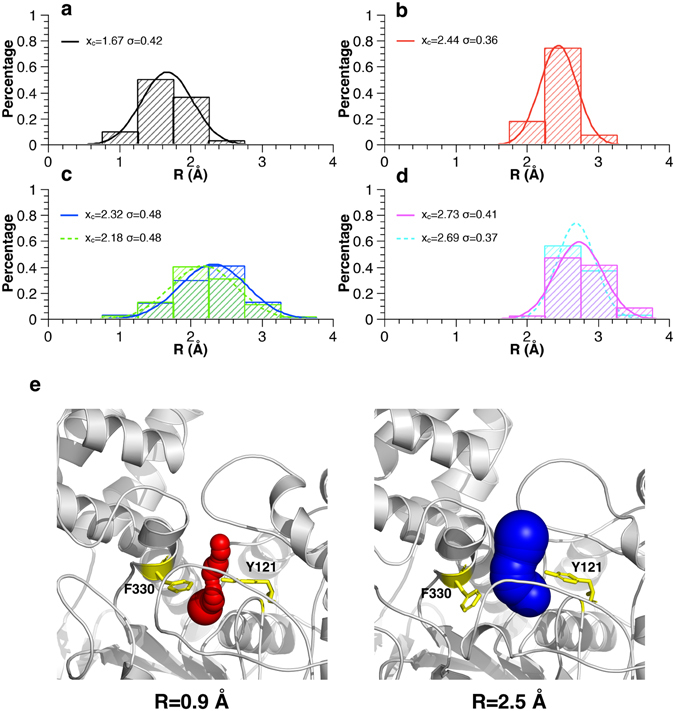
“Breathing” motions of the active-site gorge in simulations revealed by distributions of the minimal gorge radius (R). The histograms of R were normalized by dividing the calculated R values into 8 bins with the width of 0.5 Å and fitted by Gaussian curves (, y0 = 0 and A=0.5, xc is mean of the distribution and σ is standard deviation) for the monomer TcAChE (a), the TcAChE-E2020 complex (b), two chains of the apo dimer (c), and two chains of the complex dimer (d). (e) Representative structures of TcAChE extracted at 248 ns and 198 ns with R values of 0.9 and 2.5 Å, respectively, from the trajectory of the monomer TcAChE. Y121 and F330 at the “bottleneck” are shown as yellow sticks.