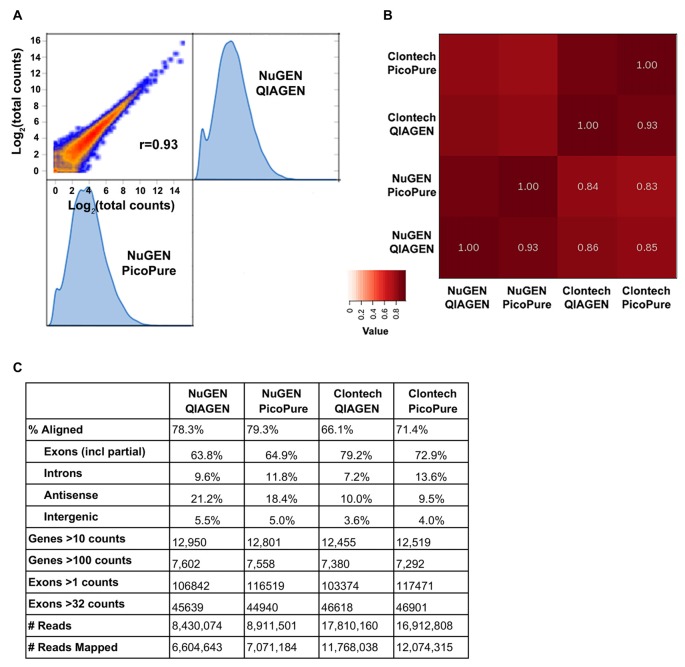
Figure 3.
Sequencing metrics comparing library kits and RNA quality. (A) Log2 expression correlation plot of NuGEN libraries made from high (QIAGEN) and low (PicoPure) quality RNA. (B) Heat map summary of correlations from NuGEN and Clontech libraries. Note that the largest variation is from the library kit and not RNA quality. (C) Table of sequencing metrics. Note that due to their larger library sizes, NuGEN samples obtained fewer total reads than Clontech. Data were normalized for read depth prior to gene and exon analyses.

