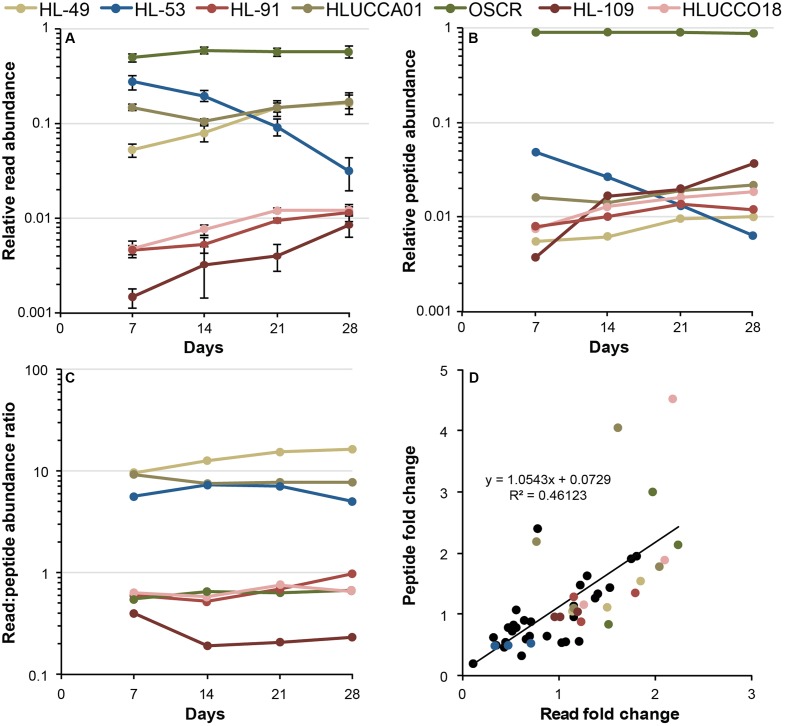
FIGURE 2.
Metatranscriptomic and metaproteomic measures of member activity dynamics. (A) Metatranscriptomic measurement of member activity during succession, represented as the fraction of the total reads per sample attributed to each organism. Values are plotted on a log10 scale, error bars denote the 95% confidence interval of the mean. (B) Metaproteomic evaluation of member activity during succession, represented as the share of peptide spectral counts attributed to each of the members. Values are plotted on a log10 scale. Error bars are omitted for clarity, but variance data are presented in Supplementary Table S3. (C) Ratio of member relative activity as assessed by metatranscriptomics to that observed by metaproteomics during succession. Flat lines (m = 0) indicate a monotonic relationship between metatranscriptomic and metaproteomic estimations. (D) Organism-centric changes in metatranscriptomic and metaproteomic estimates of relative activity across all members between sequential time points. The y-axis indicates the between-time point fold change in the relative abundance of an organism’s peptide spectral counts, and the x-axis indicates the fold change in an organism’s RNA read abundance. Colored dots represent the seven most dominant species according to the key, and black dots indicate fold changes for less-abundant species.

