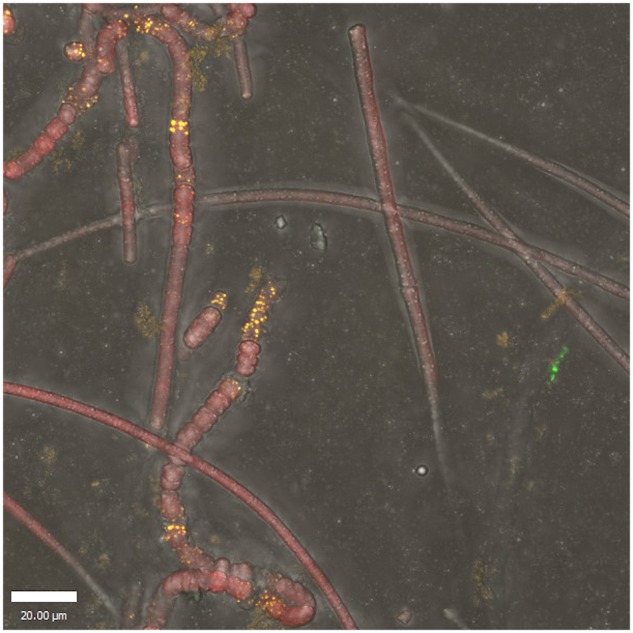
FIGURE 6.

Localization of A. marincola HL-49 within UCC-O biofilms via fluorescence in situ hybridization. Image represents a maximum-intensity Z-projection of a stack of confocal images, scale bar denotes 20 mm. Fluorescence intensity from FISH probes targeted against A. marincola HL-49 16S ribosomal RNA is depicted in yellow. Cyanobacterial chlorophyll a and phycocyanin auto-fluorescence intensity appear in red within filaments of Phormidium sp. OSCR. Fluorescence images are overlaid upon a differential interference contrast image of consortium biomass to display cell boundaries.
