Figure 1.
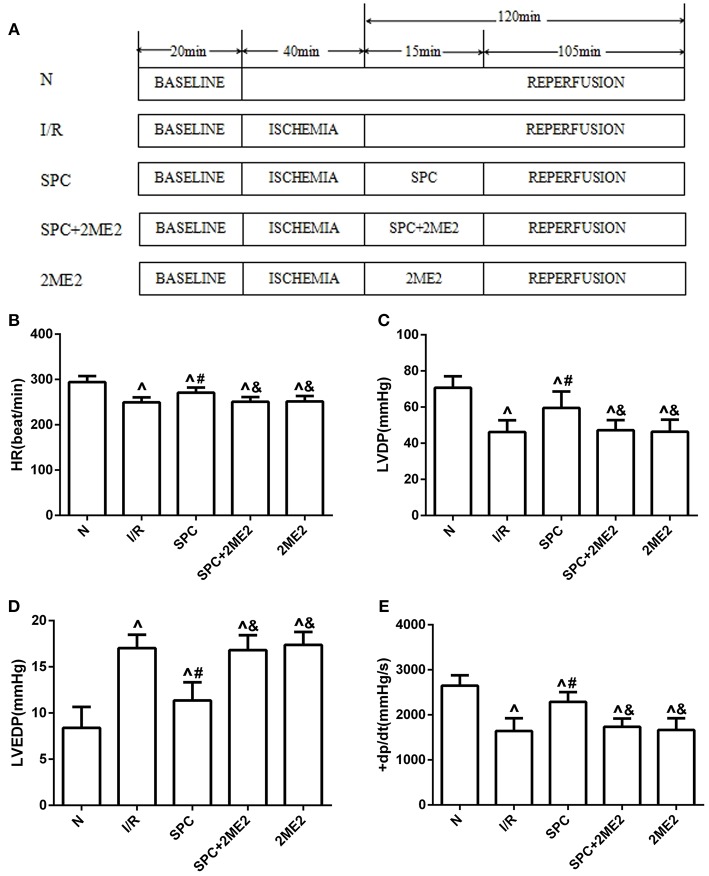
The schematic diagram of the experimental procedures. Except the N group, all hearts were subjected to 40 min whole heart ischemia, followed by reperfusion for 120 min. The SPC received 2.4% sevoflurane (1.0 MAC) treatment for 15 min, followed by reperfusion for 105 min. (A) The schematic diagram of non-diabetic rats. The cardiac function indicators under non-diabetic state. (B) Heart rate (HR, beat/per min). (C) Left ventricular developed pressure (LVDP, mmHg). (D) Left ventricular end-diastolic pressure (LVEDP, mmHg). (E) Maximum rate of increase of LV pressure (+dp/dtmax, mmHg/s; n = 12 /group). ∧P < 0.05 vs. N group; #P < 0.05 vs. I/R group; and &P < 0.01 vs. SPC group.

