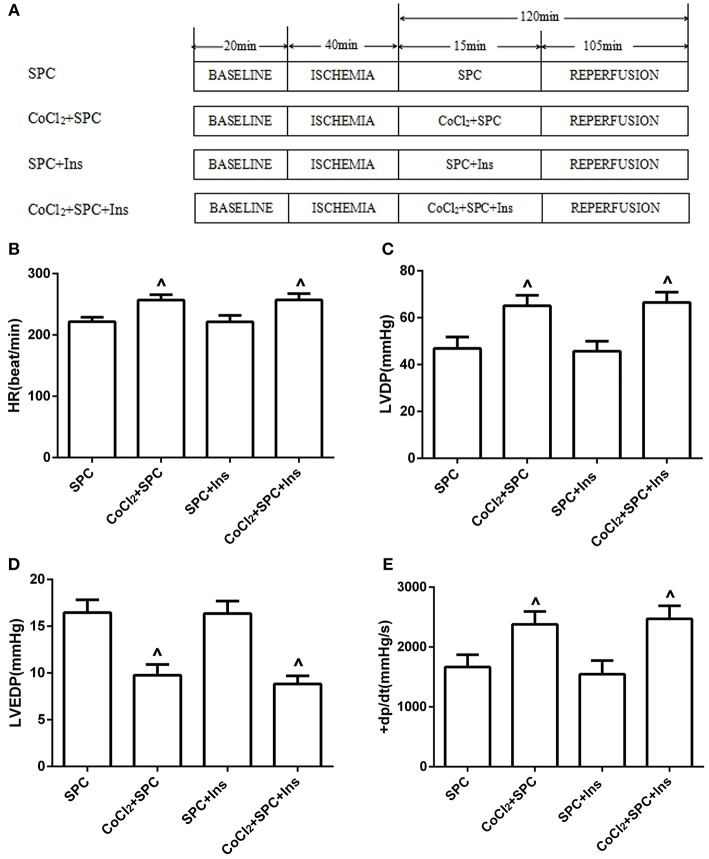
Figure 9.
The schematic diagram of the experimental procedures. All hearts were subjected to 40 min whole heart ischemia, followed by reperfusion for 120 min. The SPC received 2.4% sevoflurane (1.0 MAC) treatment for 15 min, followed by reperfusion for 105 min. (A) The schematic diagram of diabetic rats treated by insulin. Under diabetic state, the improvement of cardiac function indicators was independent of blood glucose levels. (B) Heart rate. (C) Left ventricular developed pressure. (D) Left ventricular end-diastolic pressure. (E) Maximum rate of increase of LV pressure (n = 10 /group). ∧P < 0.05 vs. SPC group.

