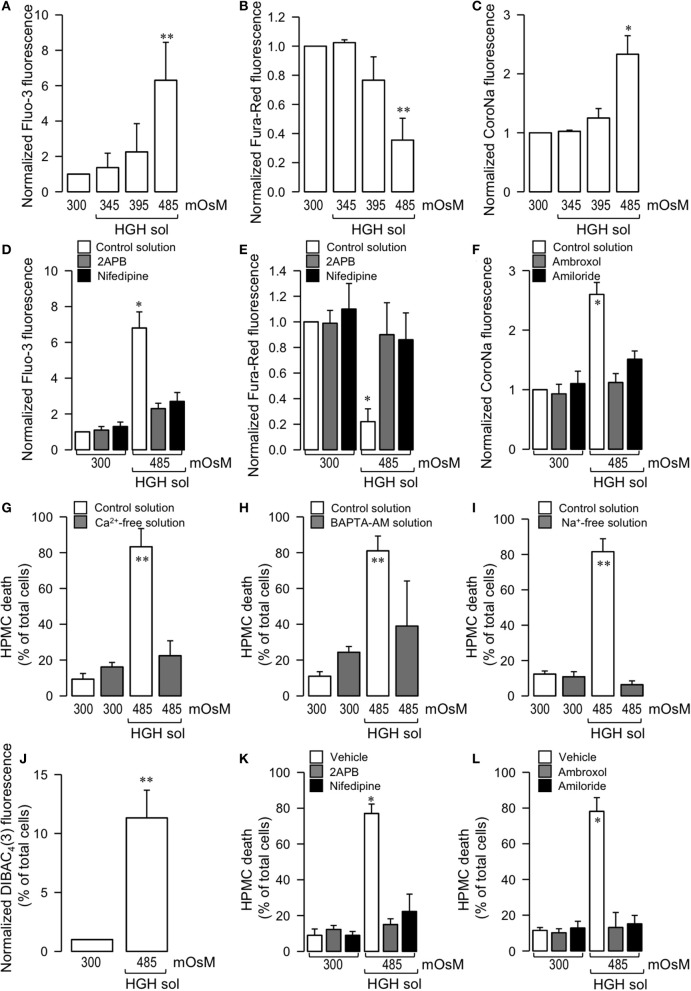
Figure 2.
Potential participation of Ca2+ and Na+ ions in HGH solution-induced HPMC death. HPMC were exposed to a control (300 mOsM) condition or exposed to 345, 395, or 485 mOsM HGH solutions for 24 h. Then, both intracellular Ca2+ (A,B) and Na+ (C) levels were determined by means of the Ca2+ sensitive dye Fluo-3 (5 μM) (A) and Fura-Red (15 μM) (B) and the Na+-sensitive dye CoroNa Green-AM (5 μM) (C). Statistical differences were assessed by one-way ANOVA (or the non-parametric Kruskal–Wallis method) followed by Dunn's post-hoc test. *P < 0.05 and **P < 0.01 against control condition (300 mOsM). Graph bars show the mean ± SD (N = 5 independent cultures). HPMC were cultured in the absence (control solution, open bars) or presence of 10 μM 2-APB (gray bars, D,E), 1 μM nidefipine (filled bars, D,E), 1 μM ambroxol (gray bars, F), and 1 μM amiloride (filled bars, F), and then exposed to the control (300 mOsM) condition or to the 485 mOsM HGH solution for 24 h. Then, both intracellular Ca2+ (D,E) and Na+ (F) levels were determined by means of the Ca2+ sensitive dye 5 μM Fluo-3 (D) and 15 μM Fura-Red (E) and the Na+-sensitive dye 5 μM CoroNa Green-AM (F). Statistical differences were assessed by two-way ANOVA followed by Tukey's post-hoc test. *P < 0.05 against control condition (300 mOsM). Graph bars show the mean ± SD (N = 7 independent cultures). HPMC death was determined in cells cultured in the absence (unfilled bars) or presence (filled bars) of a Ca2+-free solution (4 h pulse) (G), BAPTA-AM solution (5 μM, 4 h pulse) (H), and a Na+-free solution (I), and exposed to the control (300 mOsM) condition or the 485 mOsM HGH solution for 24 h. Statistical differences were assessed by two-way ANOVA followed by Tukey's post-hoc test. **P < 0.01 against control condition (300 mOsM). Graph bars show the mean ± SD (N = 7 independent cultures). Cell membrane depolarization was measured by the indicator DiBAC4(3) in cells exposed to the control (300 mOsM) condition or the 485 mOsM HGH solution (J). Statistical differences were assessed by the student's t-test (Mann-Whitney). **P < 0.01 against control condition (300 mOsM). Graph bars show the mean ± SD (N = 8 independent cultures). HPMC death was determined in cells cultured in the absence (control solution, unfilled bars) or presence of 10 μM 2-APB (gray bars, K), 1 μM nidefipine (filled bars, K), 1 μM ambroxol (gray bars, L), and 1 μM amiloride (filled bars, L), and then exposed to the control (300 mOsM) condition or the 485 mOsM HGH solution for 24 h. Statistical differences were assessed by two-way ANOVA followed by Tukey's post-hoc test. *P < 0.05 against control condition (300 mOsM). Graph bars show the mean ± SD (N = 6 independent cultures). All reagents were added 1 h before HGH solution exposure and were maintained during the experiments.

