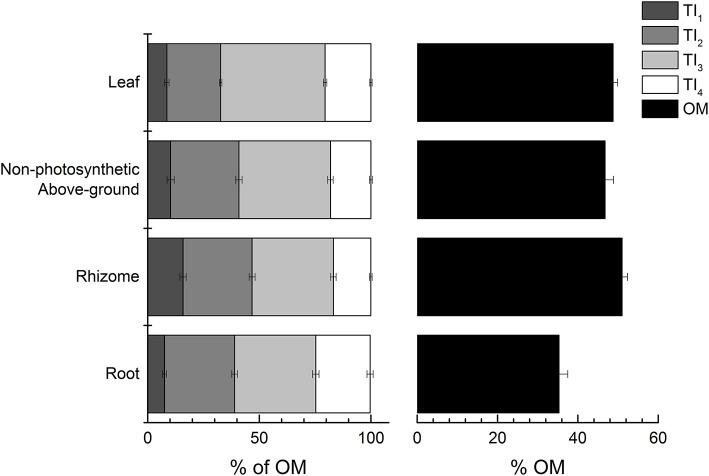
Figure 4.
Thermal intervals (TI) as percent of total organic matter (OM) and OM as percent of the total mass across all tissue types. TIs represent distinct organic matter components from TGA (see Figure 2 for TI definitions). Values represent mean ± 1 S.E.M.

