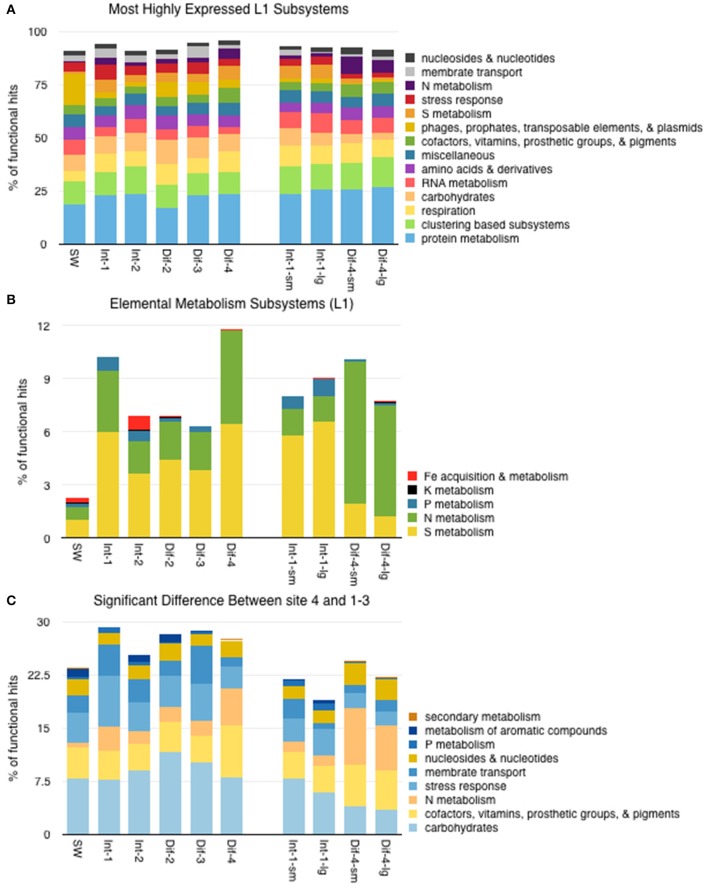
Figure 7.
(A) Distribution of functional reads assigned to the most highly expressed Level 1 SEED subsystems. (B) Distribution of functional reads assigned to Level 1 subsystems specific to elemental metabolism. (C) Distribution of functional reads of Level 1 subsystems that showed significantly different expression between Sites 1–3 and Site 4. See Supplemental Table 3 for P-Values.

