
Figure 3.
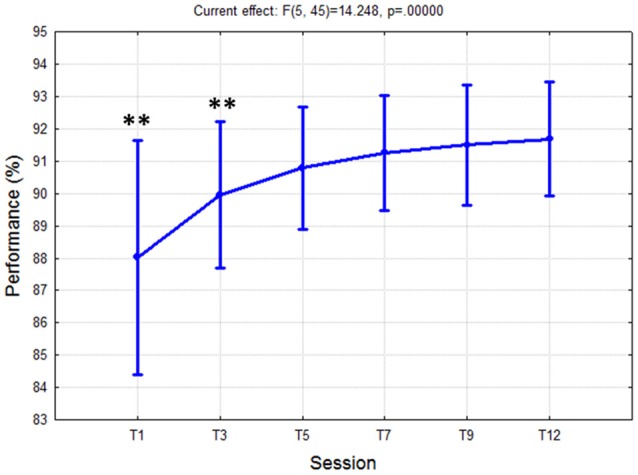
Task performance values over 3 weeks of training. The ANOVA showed a significant (p < 10−5) improvement of performance from T1 to T5, and then no differences were found between the rest of the sessions. Such results indicated that the subjects reached the task saturation in the session T5. “**” Means that the statistical significance level (p) is lower than 0.01. Vertical bars denote 0.95 confidence intervals (CI).