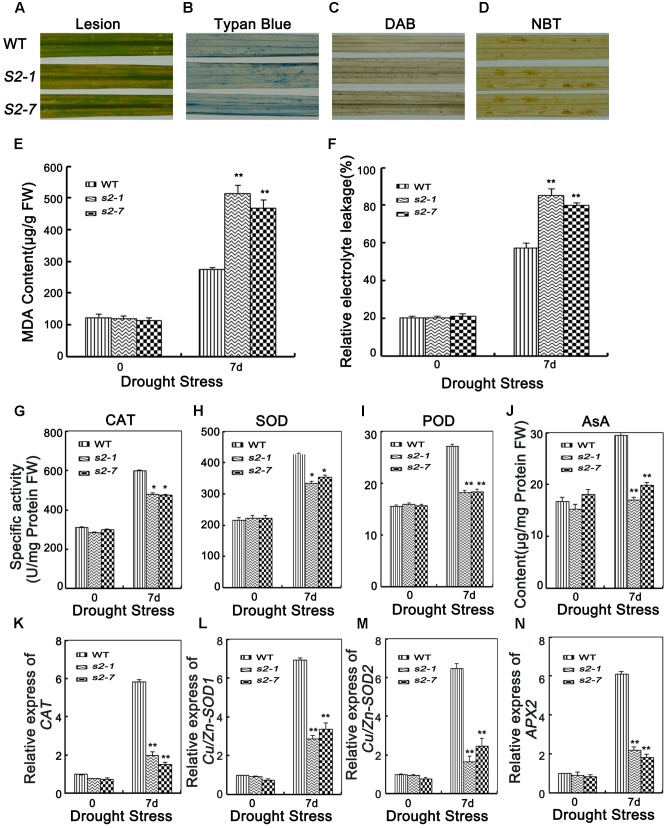
FIGURE 6.
Analyses of ROS damage, ROS-scavenging ability and the expression level of oxidative enzymes genes. (A) Phenotype of brownish lesions after 7 days drought stress. (B) Phenotype of Typan blue staining after 7 days drought stress. (C) Phenotype of DAB staining after 7 days drought stress. (D) Phenotype of NBT staining after 7 days drought stress. (E) MDA content in the leaves of 4-week-old mutants and wide type plants before and after drought stress. FW, fresh weight. (F) Relative electrolyte leakage in the leaves of 4-week-old mutants and wide type plants before and after drought stress. (G–I) POX, SOD, and CAT activities in the leaves of 4-week-old mutants and wide type plants. (J) The content of AsA in the leaves of 4-week-old mutants and wide type plants. (K) Relative expression of oxidative enzymes genes CAT, (L) Cu/Zn-SOD1, (M) Cu/Zn-SOD2, and (N) APX2 in the leaves of 4-week-old mutants and wide type plants. Error bars indicate SD from three independent RNA extracts. ∗indicate statistically significant differences between mutant lines and wild type plants (P < 0.05).

